You are not logged in.
This means you
CAN ONLY VIEW reports that were published prior to Thursday, April 17, 2025.
You
MUST UPGRADE YOUR MEMBERSHIP if you want to see any current reports.
AFTER MARKET UPDATE - MONDAY, JUNE 12TH, 2023
Previous After Market Report Next After Market Report >>>
|
|
|
|
DOW |
+189.55 |
34,066.33 |
+0.56% |
|
Volume |
878,576,282 |
+6% |
|
Volume |
4,763,260,300 |
+7% |
|
NASDAQ |
+202.78 |
13,461.92 |
+1.53% |
|
Advancers |
1,454 |
51% |
|
Advancers |
2,639 |
59% |
|
S&P 500 |
+40.07 |
4,338.93 |
+0.93% |
|
Decliners |
1,403 |
49% |
|
Decliners |
1,822 |
41% |
|
Russell 2000 |
+7.51 |
1,873.21 |
+0.40% |
|
52 Wk Highs |
91 |
|
|
52 Wk Highs |
161 |
|
|
S&P 600 |
+2.68 |
1,204.11 |
+0.22% |
|
52 Wk Lows |
10 |
|
|
52 Wk Lows |
83 |
|
|
 |
Nasdaq Compositive Led Indices' Gains With More Tech Leadership
Kenneth J. Gruneisen - Passed the CAN SLIM® Master's Exam
The Dow rose 189 points (0.6%), while the tech-heavy Nasdaq Composite climbed 1.5%, and the S&P 500 advanced 0.9%. Volume totals reported were higher on the NYSE and on the Nasdaq exchange versus the prior session. Breadth was positive with advancers leading decliners by a narrow margin on the NYSE and by nearly 3-2 on the Nasdaq exchange. There were 67 high-ranked companies from the Leaders List that hit a new 52-week high and were listed on the BreakOuts Page, versus the total of 44 on the prior session. New 52-week highs totals expanded and outnumbered new 52-week lows totals on the NYSE and on the Nasdaq exchange. The major indices are in a confirmed uptrend (M criteria). Appropriate new buying efforts may be considered under the fact-based investment system.
PICTURED: The Dow Jones Industrial Average posted a 5th consecutive small gain. It is perched -0.8% off its 2023 high and up +2.8% year-to-date.
Eight of 11 sectors rose and U.S. equities finished higher on Monday. The rally in technology companies boosted market sentiment. Information Technology led the way, up 2.1%.
Treasuries strengthened as investors await this week’s key inflation data and the Federal Reserve’s (Fed) monetary policy announcement on Wednesday. The futures market is expecting that the Fed will pause rate hikes this week but is still anticipating one more hike this year. The yield on the 10-year note and 30-year bond yield were both down one basis point (0.01%) to 3.73% and 3.87, respectively. Meanwhile, the yield on the two-year note, which is more sensitive to changes in monetary policy, declined three basis points (0.03%) to 4.57%.
In commodities, West Texas Intermediate (WTI) crude fell 4.4% to $67.08/barrel as demand concerns persist amid recent soft economic activity. |
 Kenneth J. Gruneisen started out as a licensed stockbroker in August 1987, a couple of months prior to the historic stock market crash that took the Dow Jones Industrial Average down -22.6% in a single day. He has published daily fact-based fundamental and technical analysis on high-ranked stocks online for two decades. Through FACTBASEDINVESTING.COM, Kenneth provides educational articles, news, market commentary, and other information regarding proven investment systems that work in good times and bad.
Comments contained in the body of this report are technical opinions only and are not necessarily those of Gruneisen Growth Corp. The material herein has been obtained from sources believed to be reliable and accurate, however, its accuracy and completeness cannot be guaranteed. Our firm, employees, and customers may effect transactions, including transactions contrary to any recommendation herein, or have positions in the securities mentioned herein or options with respect thereto. Any recommendation contained in this report may not be suitable for all investors and it is not to be deemed an offer or solicitation on our part with respect to the purchase or sale of any securities. |
|
 |
Financial and Energy Groups Fell as Retail and Tech Rose
Kenneth J. Gruneisen - Passed the CAN SLIM® Master's Exam
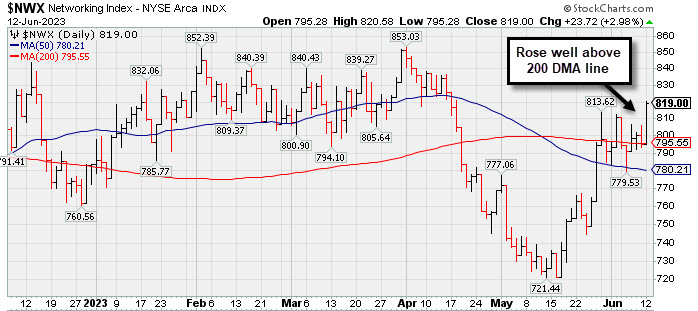
The Retail ($RLX +1.90%) posted a solid gain while the Bank ($BKX -1.15%) and the Broker/Dealer ($XBD -0.43%) both lost ground. The tech sector had a positive bias as the Semiconductor ($SOX +3.09%) and the Networking ($NWX +2.98%) both posted solid gains and the Biotech ($BTK +0.98%) posted a smaller gain. The Gold & Silver $XAU (+0.08%) finished flat while the Oil Services ($OSX -2.02%) and the Integrated Oil ($XOI -1.30%) both lost ground.
PICTURED: The Networking ($NWX +2.98%) posted a solid gain rising well above its 200-day moving average (DMA) line.
| Oil Services |
$OSX |
75.71 |
-1.56 |
-2.02% |
-9.72% |
| Integrated Oil |
$XOI |
1,657.92 |
-21.90 |
-1.30% |
-7.24% |
| Semiconductor |
$SOX |
3,633.91 |
+108.94 |
+3.09% |
+43.51% |
| Networking |
$NWX |
818.97 |
+23.68 |
+2.98% |
+4.55% |
| Broker/Dealer |
$XBD |
462.84 |
-2.00 |
-0.43% |
+3.05% |
| Retail |
$RLX |
3,354.24 |
+62.57 |
+1.90% |
+21.80% |
| Gold & Silver |
$XAU |
123.99 |
+0.10 |
+0.08% |
+2.59% |
| Bank |
$BKX |
81.15 |
-0.94 |
-1.15% |
-19.53% |
| Biotech |
$BTK |
5,413.18 |
+52.76 |
+0.98% |
+2.50% |
|
|
|
 |
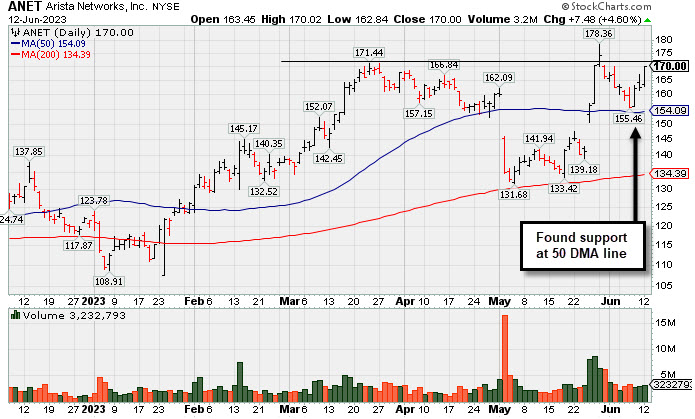
Rebounding Near Recent High With 3 Consecutive Gains
Kenneth J. Gruneisen - Passed the CAN SLIM® Master's Exam
Arista Networks Inc (ANET +$6.51 or +4.00% to $169.03) posted a 3rd consecutive gain backed by average volume. It stalled after recent gains triggered a technical buy signal. Its 50-day moving average (DMA) line ($154) defines important near-term support to watch.
Its color code was changed to yellow with new pivot point cited based on its 3/23/23 high plus 10 cents in the 5/30/23 mid-day report. Fundamentals remain strong, however, weak action came after it reported Mar '23 quarterly earnings +70% on +54% sales revenues versus the year-ago period but gave conservative guidance going forward.
ANET currently has a 98 Earnings Per Share Rating. It has shown 6 consecutive quarterly comparisons with strong and steady above the +25% minimum earnings guideline (C criteria). Annual earnings (A criteria) had a downturn in FY '20 like many companies during the pandemic.
The number of top-rated funds owning its shares rose from 1,758 in Dec '21 to 2,186 in Mar '23, a reassuring sign concerning the I criteria. Its current Up/Down Volume Ratio of 1.1 is an unbiased indication its shares have been nearly neutral concerning accumulation/distribution over the past 50 days. The high-ranked Computer - Networking firm has a Timeliness Rating of A and a Sponsorship Rating of C. Its small supply of 246.6 million shares (S criteria) in the public float may contribute to greater volatility in the event of institutional buying or selling.
|
|
|
Color Codes Explained :
Y - Better candidates highlighted by our
staff of experts.
G - Previously featured
in past reports as yellow but may no longer be buyable under the
guidelines.
***Last / Change / Volume data in this table is the closing quote data***
Symbol/Exchange
Company Name
Industry Group |
PRICE |
CHANGE
(%Change) |
Day High |
Volume
(% DAV)
(% 50 day avg vol) |
52 Wk Hi
% From Hi |
Featured
Date |
Price
Featured |
Pivot Featured |
|
Max Buy |
 GPK
-
NYSE
GPK
-
NYSE
Graphic Packaging
Paper and Paper Products
|
$26.96
|
+0.44
1.66% |
$27.02
|
4,348,022
154.84% of 50 DAV
50 DAV is 2,808,000
|
$26.71
0.94%
|
10/25/2022
|
$22.75
|
PP = $24.17
|
|
MB = $25.38
|
Most Recent Note - 6/8/2023 7:13:35 PM
G - Hit a new all-time high with today's 6th consecutive gain. It did not form a sound new base of sufficient length but quickly recovered after testing its 4/27/23 low last week. Reported Mar '23 quarterly earnings +60% on +9% sales revenues versus the year-ago period. See the latest FSU analysis for more details and a new annotated graph.
>>> FEATURED STOCK ARTICLE : Graphic Packaging Hits New High With 6th Consecutive Gain - 6/8/2023 |
View all notes |
Set NEW NOTE alert |
Company Profile |
SEC
News |
Chart |
Request a new note
C
A
S
I |
STRL
-
NASDAQ
Sterling Infrastructure
Bldg-Heavy Construction
|
$52.75
|
-0.74
-1.38% |
$53.69
|
412,894
160.66% of 50 DAV
50 DAV is 257,000
|
$53.97
-2.26%
|
12/14/2022
|
$32.41
|
PP = $33.72
|
|
MB = $35.41
|
Most Recent Note - 6/7/2023 5:19:22 PM
G - Hit yet another new all-time high with today's 14th gain in the span of 15 sessions, very extended from any sound base. Mar '23 quarterly earnings were below the +25% minimum guideline (C criteria). See the latest FSU analysis for more details and a new annotated graph.
>>> FEATURED STOCK ARTICLE : Impressive Streak of Gains for New Highs - 6/7/2023 |
View all notes |
Set NEW NOTE alert |
Company Profile |
SEC
News |
Chart |
Request a new note
C
A
S
I |
FIX
-
NYSE
Comfort Systems USA
Bldg-A/C and Heating Prds
|
$160.29
|
+2.25
1.42% |
$162.75
|
328,900
119.17% of 50 DAV
50 DAV is 276,000
|
$161.94
-1.02%
|
4/27/2023
|
$148.85
|
PP = $152.23
|
|
MB = $159.84
|
 Most Recent Note - 6/12/2023 6:08:15 PM
G - Color code is changed to green after hitting a new all-time high and closing above its "max buy" level with today's big gain backed by +19% above average volume. No resistance remains due to overhead supply.
>>> FEATURED STOCK ARTICLE : Churning Action While Recently Hovering Near All-Time High - 5/12/2023 |
View all notes |
Set NEW NOTE alert |
Company Profile |
SEC
News |
Chart |
Request a new note
C
A
S
I |
KOF
-
NYSE
Coca-Cola Femsa ADR
Beverages-Non-Alcoholic
|
$88.38
|
-0.23
-0.26% |
$89.00
|
171,337
88.78% of 50 DAV
50 DAV is 193,000
|
$91.23
-3.12%
|
6/9/2023
|
$88.61
|
PP = $91.33
|
|
MB = $95.90
|
Most Recent Note - 6/9/2023 5:52:26 PM
Y - Posted a 7th consecutive gain today after finding support near its 50 DMA line ($85.16). Color code is changed to yellow with new pivot point based on its 5/09/23 high plus 10 cents. Recent lows in the $81.50 area define the next important support to watch below its 50 DMA line. Reported Mar '23 quarterly earnings +53% on +24% sales revenues versus the year-ago period. See the latest FSU analysis for more details and a new annotated graph.
>>> FEATURED STOCK ARTICLE : Coca-Cola Femsa Posts 7th Consecutive Gain - 6/9/2023 |
View all notes |
Set NEW NOTE alert |
Company Profile |
SEC
News |
Chart |
Request a new note
C
A
S
I |
CLH
-
NYSE
Clean Harbors
Pollution Control
|
$157.62
|
+1.24
0.79% |
$158.39
|
287,020
74.74% of 50 DAV
50 DAV is 384,000
|
$158.72
-0.69%
|
3/10/2023
|
$136.89
|
PP = $136.74
|
|
MB = $143.58
|
Most Recent Note - 6/9/2023 12:25:35 PM
G - Perched at its all-time high following 3 consecutive gains. Its 50 DMA line ($142.71) defines near-term support to watch on pullbacks. Reported Mar '23 quarterly earnings +64% on +12% sales revenues versus the year-ago period. Fundamentals remain strong.
>>> FEATURED STOCK ARTICLE : Showed Resilience Near 50-Day Moving Average Following Sell-Off - 5/10/2023 |
View all notes |
Set NEW NOTE alert |
Company Profile |
SEC
News |
Chart |
Request a new note
C
A
S
I |
Symbol/Exchange
Company Name
Industry Group |
PRICE |
CHANGE
(%Change) |
Day High |
Volume
(% DAV)
(% 50 day avg vol) |
52 Wk Hi
% From Hi |
Featured
Date |
Price
Featured |
Pivot Featured |
|
Max Buy |
SPSC
-
NASDAQ
SPS Commerce
Comp Sftwr-Spec Enterprs
|
$177.14
|
+5.05
2.93% |
$177.34
|
227,163
154.53% of 50 DAV
50 DAV is 147,000
|
$173.27
2.23%
|
4/24/2023
|
$150.01
|
PP = $157.56
|
|
MB = $165.44
|
Most Recent Note - 6/12/2023 6:13:44 PM
G - Hit yet another new 52-week high with today's 3rd consecutive gain backed by +54% above average volume. Reported Mar '23 quarterly earnings +22% on +20% versus the year-ago period, below the +25% minimum earnings guideline (C criteria) raising some fundamental concerns.
>>> FEATURED STOCK ARTICLE : Pulled Back After Quietly Wedging to New Highs - 5/31/2023 |
View all notes |
Set NEW NOTE alert |
Company Profile |
SEC
News |
Chart |
Request a new note
C
A
S
I |
HUBB
-
NYSE
Hubbell
Electrical-Power/Equipmt
|
$310.70
|
+3.84
1.25% |
$311.69
|
378,656
94.19% of 50 DAV
50 DAV is 402,000
|
$307.04
1.19%
|
4/25/2023
|
$262.85
|
PP = $257.51
|
|
MB = $270.39
|
Most Recent Note - 6/7/2023 5:20:35 PM
G - Gain today with average volume hit yet another new all-time high, getting more extended from the prior base. Prior highs in the $263 area define initial support to watch on pullbacks. Fundamentals remain strong.
>>> FEATURED STOCK ARTICLE : Extended From Prior Base and Perched Near High - 6/1/2023 |
View all notes |
Set NEW NOTE alert |
Company Profile |
SEC
News |
Chart |
Request a new note
C
A
S
I |
NVR
-
NYSE
NVR
Bldg-Resident/Comml
|
$5,868.86
|
+50.90
0.87% |
$5,903.66
|
16,979
70.75% of 50 DAV
50 DAV is 24,000
|
$5,986.96
-1.97%
|
4/25/2023
|
$5,882.18
|
PP = $5,978.25
|
|
MB = $6,277.16
|
Most Recent Note - 6/6/2023 5:16:26 PM
G - Rebounded further above its 50 DMA line ($5,707) with today's light volume gain helping its technical stance. Reported Mar '23 quarterly earnings -14% on -3% sales revenues versus the year-ago period, below the +25% minimum earnings guideline (C criteria) raising fundamental concerns, and its color code was changed to green. Prior quarterly comparisons were well above the +25% minimum earnings guideline (C criteria). Annual earnings (A criteria) growth has been very strong. See the latest FSU analysis for more details and a new annotated graph.
>>> FEATURED STOCK ARTICLE : Rebounded Above 50 Day Average With Light Volume Gains - 6/6/2023 |
View all notes |
Set NEW NOTE alert |
Company Profile |
SEC
News |
Chart |
Request a new note
C
A
S
I |
PHM
-
NYSE
PulteGroup
Bldg-Resident/Comml
|
$72.90
|
+0.91
1.26% |
$73.44
|
2,365,296
81.09% of 50 DAV
50 DAV is 2,917,000
|
$72.89
0.01%
|
4/25/2023
|
$65.17
|
PP = $64.01
|
|
MB = $67.21
|
Most Recent Note - 6/12/2023 6:12:42 PM
G - Hit yet another new high with today's 2nd consecutive gain backed by below average volume, getting more extended from any sound base. Reported earnings +28% for the Mar '23 quarter versus the year-ago period. Important support to watch is defined by its 50 DMA line ($65) and recent low.
>>> FEATURED STOCK ARTICLE : Rebounded Above "Max Buy" Level Toward Recent High - 6/2/2023 |
View all notes |
Set NEW NOTE alert |
Company Profile |
SEC
News |
Chart |
Request a new note
C
A
S
I |
COKE
-
NASDAQ
Coca-Cola Consolidated
Beverages-Non-Alcoholic
|
$654.44
|
-11.74
-1.76% |
$670.00
|
52,671
146.31% of 50 DAV
50 DAV is 36,000
|
$694.20
-5.73%
|
5/4/2023
|
$646.66
|
PP = $656.21
|
|
MB = $689.02
|
Most Recent Note - 6/8/2023 12:48:26 PM
Y - Pulled back below its "max buy" level with recent volume-driven losses. Recent lows in the $625 area define important near-term support above its 50 DMA line. Fundamentals remain strong.
>>> FEATURED STOCK ARTICLE : COKE is Showing Real Strength - 5/4/2023 |
View all notes |
Set NEW NOTE alert |
Company Profile |
SEC
News |
Chart |
Request a new note
C
A
S
I |
Symbol/Exchange
Company Name
Industry Group |
PRICE |
CHANGE
(%Change) |
Day High |
Volume
(% DAV)
(% 50 day avg vol) |
52 Wk Hi
% From Hi |
Featured
Date |
Price
Featured |
Pivot Featured |
|
Max Buy |
AMPH
-
NASDAQ
Amphastar Pharm
Medical-Biomed/Biotech
|
$47.23
|
+1.56
3.42% |
$47.46
|
452,530
111.74% of 50 DAV
50 DAV is 405,000
|
$46.86
0.79%
|
5/15/2023
|
$43.56
|
PP = $44.15
|
|
MB = $46.36
|
Most Recent Note - 6/12/2023 6:10:42 PM
G - Hit a new all-time high and closed above its "max buy" level today and its color code is changed to green. Prior highs in the $44 area define initial support to watch on pullbacks. Fundamentals remain strong.
>>> FEATURED STOCK ARTICLE : Weak Finish After Early Gain When Perched Near All-Time High - 5/15/2023 |
View all notes |
Set NEW NOTE alert |
Company Profile |
SEC
News |
Chart |
Request a new note
C
A
S
I |
ANET
-
NYSE
Arista Networks
Computer-Networking
|
$170.00
|
+7.48
4.60% |
$170.02
|
3,232,860
100.00% of 50 DAV
50 DAV is 3,233,000
|
$178.36
-4.69%
|
5/30/2023
|
$176.35
|
PP = $171.54
|
|
MB = $180.12
|
Most Recent Note - 6/12/2023 6:05:36 PM
Y - Posted a 3rd consecutive gain today with average volume. Stalled after recent gains triggered a technical buy signal. Its 50 DMA line ($154) defines important near-term support to watch. Fundamentals remain strong. See the latest FSU analysis for more details and a new annotated graph.
>>> FEATURED STOCK ARTICLE : Rebounding Near Recent High With 3 Consecutive Gains - 6/12/2023 |
View all notes |
Set NEW NOTE alert |
Company Profile |
SEC
News |
Chart |
Request a new note
C
A
S
I |
PANW
-
NASDAQ
Palo Alto Networks
Computer Sftwr-Security
|
$229.14
|
+9.04
4.11% |
$229.29
|
5,421,833
124.30% of 50 DAV
50 DAV is 4,362,000
|
$230.18
-0.45%
|
6/5/2023
|
$228.35
|
PP = $213.73
|
|
MB = $224.42
|
Most Recent Note - 6/12/2023 6:14:34 PM
Y - Posted a solid gain today backed by +24% above average volume for a best-ever close. The prior high ($213) defines initial support to watch. Fundamentals remain strong.
>>> FEATURED STOCK ARTICLE : Palo Alto Powers to New Highs Again - 6/5/2023 |
View all notes |
Set NEW NOTE alert |
Company Profile |
SEC
News |
Chart |
Request a new note
C
A
S
I |
|
|
|
THESE ARE NOT BUY RECOMMENDATIONS!
Comments contained in the body of this report are technical
opinions only. The material herein has been obtained
from sources believed to be reliable and accurate, however,
its accuracy and completeness cannot be guaranteed.
This site is not an investment advisor, hence it does
not endorse or recommend any securities or other investments.
Any recommendation contained in this report may not
be suitable for all investors and it is not to be deemed
an offer or solicitation on our part with respect to
the purchase or sale of any securities. All trademarks,
service marks and trade names appearing in this report
are the property of their respective owners, and are
likewise used for identification purposes only.
This report is a service available
only to active Paid Premium Members.
You may opt-out of receiving report notifications
at any time. Questions or comments may be submitted
by writing to Premium Membership Services 665 S.E. 10 Street, Suite 201 Deerfield Beach, FL 33441-5634 or by calling 1-800-965-8307
or 954-785-1121.
|
|
|