You are not logged in.
This means you
CAN ONLY VIEW reports that were published prior to Thursday, April 17, 2025.
You
MUST UPGRADE YOUR MEMBERSHIP if you want to see any current reports.
AFTER MARKET UPDATE - WEDNESDAY, MAY 10TH, 2023
Previous After Market Report Next After Market Report >>>
|
|
|
|
DOW |
-30.48 |
33,531.33 |
-0.09% |
|
Volume |
910,760,128 |
+3% |
|
Volume |
4,992,790,300 |
+19% |
|
NASDAQ |
+126.89 |
12,306.44 |
+1.04% |
|
Advancers |
1,668 |
58% |
|
Advancers |
2,521 |
57% |
|
S&P 500 |
+18.47 |
4,137.64 |
+0.45% |
|
Decliners |
1,217 |
42% |
|
Decliners |
1,885 |
43% |
|
Russell 2000 |
+9.83 |
1,759.51 |
+0.56% |
|
52 Wk Highs |
55 |
|
|
52 Wk Highs |
106 |
|
|
S&P 600 |
+4.34 |
1,130.57 |
+0.39% |
|
52 Wk Lows |
63 |
|
|
52 Wk Lows |
172 |
|
|
 |
Nasdaq Composite Hits 2023 High and Leads Major Indices Higher
Kenneth J. Gruneisen - Passed the CAN SLIM® Master's Exam
The Dow fell 30 points (-0.1%), while the Nasdaq Composite climbed 1% and the S&P 500 added 0.5%. Volume totals reported were higher on the NYSE and on the Nasdaq exchange, indicative of an increase in institutional buying demand. Advancers led decliners by a 4-3 margin on the NYSE and by more than 5-4 on the Nasdaq exchange. Leadership improved as there were 40 high-ranked companies from the Leaders List that hit a new 52-week high and were listed on the BreakOuts Page, versus the total of 34 on the prior session. However, new 52-week lows still outnumbered new highs on the NYSE and on the Nasdaq exchange. The major indices are in an uptrend under pressure (M criteria). Appropriate new buying efforts may be considered under the fact-based investment system.
PICTURED: The Nasdaq Composite Index found support above its 50-day moving average (DMA) line recently and hit a new 2023 high with Wednesday's solid gain.
Seven of 11 sectors finished in positive territory amid a rally in Technology shares and as investors digested April’s Consumer Price Index (CPI) data. On a monthly basis, headline CPI accelerated, coming in at 0.4% versus March’s 0.1% monthly gain. On an annual basis, CPI came in at 4.9%, easing from March’s 5% print. Core CPI, which excludes the more volatile food and energy prices, came in at 0.4% month-over-month and 5.5% year-over-year. The report indicated housing costs, which make up a large portion of the CPI, led price gains.
Elsewhere on the data front, Mortgage Bankers’ Association (MBA) mortgage applications climbed 6.3% in the week ended May 5 as mortgage rates eased. The MBA’s report also showed refinancing applications rose for the third-straight week to notch their highest level since September. Treasuries strengthened following the CPI report, with the yield on the benchmark 10-year note down eight basis points (0.08%) to 3.44%, while the 30-year bond yield shed five basis points (0.05%) to 3.79%. The yield on the two-year note, which is more sensitive to changes in Fed policy, slid 12 basis points (0.12%) to 3.91%. In commodities, West Texas Intermediate (WTI) crude declined 1.3% to $72.76 /barrel amid signs of easing demand. The Energy Information Administration (EIA) reported domestic crude stockpiles rose by around 3 million barrels last week. |
 Kenneth J. Gruneisen started out as a licensed stockbroker in August 1987, a couple of months prior to the historic stock market crash that took the Dow Jones Industrial Average down -22.6% in a single day. He has published daily fact-based fundamental and technical analysis on high-ranked stocks online for two decades. Through FACTBASEDINVESTING.COM, Kenneth provides educational articles, news, market commentary, and other information regarding proven investment systems that work in good times and bad.
Comments contained in the body of this report are technical opinions only and are not necessarily those of Gruneisen Growth Corp. The material herein has been obtained from sources believed to be reliable and accurate, however, its accuracy and completeness cannot be guaranteed. Our firm, employees, and customers may effect transactions, including transactions contrary to any recommendation herein, or have positions in the securities mentioned herein or options with respect thereto. Any recommendation contained in this report may not be suitable for all investors and it is not to be deemed an offer or solicitation on our part with respect to the purchase or sale of any securities. |
|
 |
Retail and Tech Indexes Rose
Kenneth J. Gruneisen - Passed the CAN SLIM® Master's Exam
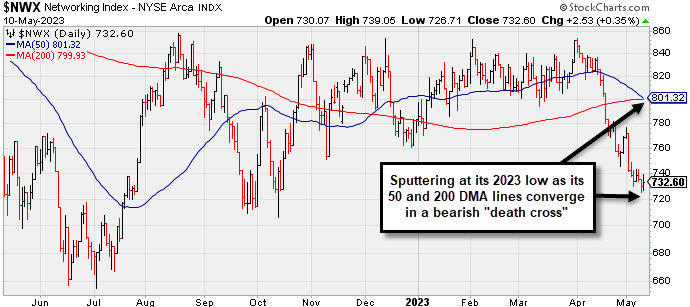
The Retail Index ($RLX +1.54%) posted a solid gain but the Bank Index ($BKX -1.26%) and Broker/Dealer Index ($XBD -0.23%) both lost ground and created a drag on the major indices. The tec sectoir had a positive bias as the Semiconductor Index ($SOX +1.00%), Biotech Index ($BTK +0.98%), and Networking Index ($NWX +0.35%) posted unanimous gains. Commodity-linked groups had a negative bias as the Oil Services Index ($OSX -1.19%), Integrated Oil Index ($XOI -0.64%), and Gold & Silver Index ($XAU -0.83%) each lost ground.
PICTURED: The Networking Index ($NWX +0.35%) is sputtering at its 2023 low as its 50-day and 200-day moving average (DMA) lines converge in a bearish "death cross".
| Oil Services |
$OSX |
73.92 |
-0.89 |
-1.19% |
-11.85% |
| Integrated Oil |
$XOI |
1,646.40 |
-10.61 |
-0.64% |
-7.88% |
| Semiconductor |
$SOX |
2,997.51 |
+29.67 |
+1.00% |
+18.38% |
| Networking |
$NWX |
732.60 |
+2.53 |
+0.35% |
-6.47% |
| Broker/Dealer |
$XBD |
432.58 |
-0.99 |
-0.23% |
-3.68% |
| Retail |
$RLX |
3,103.94 |
+47.06 |
+1.54% |
+12.71% |
| Gold & Silver |
$XAU |
138.91 |
-1.16 |
-0.83% |
+14.93% |
| Bank |
$BKX |
74.16 |
-0.94 |
-1.26% |
-26.47% |
| Biotech |
$BTK |
5,323.05 |
+51.63 |
+0.98% |
+0.79% |
|
|
|
 |
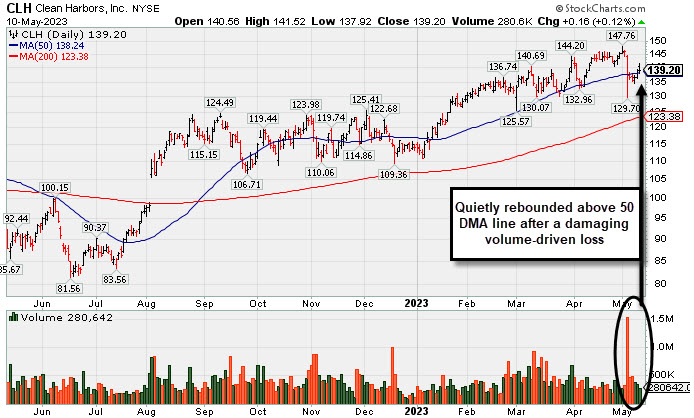
Showed Resilience Near 50-Day Moving Average Following Sell-Off
Kenneth J. Gruneisen - Passed the CAN SLIM® Master's Exam
Clean Harbors Inc (CLH +$0.16 or +0.12% to $139.20) posted a 3rd consecutive gain with below-average volume today. It found support near its 50-day moving average (DMA) line ($138.24) after a big loss last week triggered a technical sell signal. More damaging losses would raise greater concerns. CLH reported Mar '23 quarterly earnings +64% on +12% sales revenues versus the year-ago period. Fundamentals remain strong.
CLH was highlighted in yellow in the 3/10/23 mid-day report (read here) as it was noted that a valid secondary buy point exists up to 5% above the recent high following a pullback to support at the 10 WMA line after an earlier breakout. It was last shown in this FSU section on 4/19/23 with an annotated graph under the headline, "Wedged to a New High Close Above 'Max Buy' Level".
CLH has an Earnings Per Share Rating of 99. It reported Dec '22 quarterly earnings +62% on +14% sales revenues versus the year ago period. Prior quarters showed a strong earnings track record with earnings above the +25% minimum guideline (C criteria). Annual earnings (A criteria) growth has been strong and steady.
There are only 54.1 million shares outstanding (S criteria), which can contribute to greater price volatility in the event of institutional buying or selling. The number of top-rated funds owning its shares rose from 590 in Sep '21 to 742 in Mar '23, a reassuring sign concerning the I criteria. The current Up/Down Volume Ratio of 0.9 is an unbiased indication its shares have been neutral concerning accumulation/distribution over the past 50 days. It has a Timeliness Rating of A , a Sponsorship Rating of C, abd an Accumulation Distribution Rating of C+.
|
|
|
Color Codes Explained :
Y - Better candidates highlighted by our
staff of experts.
G - Previously featured
in past reports as yellow but may no longer be buyable under the
guidelines.
***Last / Change / Volume data in this table is the closing quote data***
Symbol/Exchange
Company Name
Industry Group |
PRICE |
CHANGE
(%Change) |
Day High |
Volume
(% DAV)
(% 50 day avg vol) |
52 Wk Hi
% From Hi |
Featured
Date |
Price
Featured |
Pivot Featured |
|
Max Buy |
 GPK
-
NYSE
GPK
-
NYSE
Graphic Packaging
CONSUMER NON-DURABLES - Packaging and Containers
|
$25.90
|
+0.18
0.70% |
$26.16
|
3,949,597
128.65% of 50 DAV
50 DAV is 3,070,000
|
$26.11
-0.80%
|
10/25/2022
|
$22.75
|
PP = $24.17
|
|
MB = $25.38
|
 Most Recent Note - 5/10/2023 12:10:15 PM
G - Touched a new all-time high again today. Color code was changed to green while hovering above its "max buy" level with volume totals cooling. Reported Mar '23 quarterly earnings +60% on +9% sales revenues versus the year-ago period. Its 50 DMA line ($24.68) defines important near-term support to watch on pullbacks.
>>> FEATURED STOCK ARTICLE : Packaging Firm Due to Report Earnings News - 5/1/2023 |
View all notes |
Set NEW NOTE alert |
Company Profile |
SEC
News |
Chart |
Request a new note
C
A
S
I |
STRL
-
NASDAQ
Sterling Infrastructure
MATERIALS and; CONSTRUCTION - Heavy Construction
|
$42.92
|
+0.00
0.00% |
$43.60
|
171,584
66.76% of 50 DAV
50 DAV is 257,000
|
$43.05
-0.30%
|
12/14/2022
|
$32.41
|
PP = $33.72
|
|
MB = $35.41
|
Most Recent Note - 5/4/2023 6:11:46 PM
G - Pulled back today after hitting a new all-time high with 5 consecutive gains backed by ever-increasing volume. Rebound above the 50 DMA line ($38) this week helped its technical stance improve. Reported Mar '23 quarterly earnings +0% on +10% sales revenues versus the year-ago period, below the +25% minimum earnings guideline (C criteria) raising fundamental concerns. Volume and volatility often increase near earnings news.
>>> FEATURED STOCK ARTICLE : 50-Day Moving Average Line Acted as Recent Resistance - 4/28/2023 |
View all notes |
Set NEW NOTE alert |
Company Profile |
SEC
News |
Chart |
Request a new note
C
A
S
I |
FIX
-
NYSE
Comfort Systems USA
MATERIALS and CONSTRUCTION - General Contractors
|
$150.30
|
+1.95
1.31% |
$150.65
|
402,803
136.08% of 50 DAV
50 DAV is 296,000
|
$154.15
-2.50%
|
4/27/2023
|
$148.85
|
PP = $152.23
|
|
MB = $159.84
|
Most Recent Note - 5/8/2023 7:38:49 PM
Y - Pulled back today with lighter volume after hitting a new high on the prior session with a volume-driven gain. Previously noted - "Bullish action came after it reported Mar '23 quarterly earnings +66% on +33% sales revenues versus the year-ago period. Powered above its 50 DMA line ($140.70) with a considerable gain backed by twice its average volume. Its color code was changed to yellow with pivot point cited based on its 3/03/23 high plus 10 cents. Very little resistance remains due to overhead supply up to the $152 level. A gain and new high backed by at least +40% above average volume may trigger a technical buy signal."
>>> FEATURED STOCK ARTICLE : Consolidating Near 50-Day Moving Average and -10.5% off High - 4/21/2023 |
View all notes |
Set NEW NOTE alert |
Company Profile |
SEC
News |
Chart |
Request a new note
C
A
S
I |
KOF
-
NYSE
Coca-Cola Femsa ADR
FOOD and BEVERAGE - Beverages - Soft Drinks
|
$90.27
|
-0.06
-0.07% |
$90.68
|
284,571
145.19% of 50 DAV
50 DAV is 196,000
|
$91.23
-1.05%
|
3/7/2023
|
$76.63
|
PP = $77.11
|
|
MB = $80.97
|
Most Recent Note - 5/8/2023 7:41:17 PM
G - Hit another new all-time high with above-average volume behind today's 5th consecutive gain. Reported Mar '23 quarterly earnings +53% on +24% sales revenues versus the year-ago period. On pullbacks, prior highs in the $79-$77 area define initial support to watch along with its 50 DMA line ($80.14).
>>> FEATURED STOCK ARTICLE : Posted Gain Afrer Reporting Strong Mar '23 Quarterly Results - 5/2/2023 |
View all notes |
Set NEW NOTE alert |
Company Profile |
SEC
News |
Chart |
Request a new note
C
A
S
I |
CLH
-
NYSE
Clean Harbors
Pollution Control
|
$139.20
|
+0.16
0.12% |
$141.52
|
280,642
62.78% of 50 DAV
50 DAV is 447,000
|
$147.76
-5.79%
|
3/10/2023
|
$136.89
|
PP = $136.74
|
|
MB = $143.58
|
Most Recent Note - 5/10/2023 5:47:17 PM
Y - Found support near its 50 DMA line ($138.24) after a big loss last week triggered a technical sell signal. More damaging losses would raise greater concerns. Reported Mar '23 quarterly earnings +64% on +12% sales revenues versus the year-ago period. Recently wedged up above its "max buy" level with gains backed by lackluster volume, not action considered indicative of fresh institutional buying demand. Fundamentals remain strong. See the latest FSU analysis for more details and a new annotated graph.
>>> FEATURED STOCK ARTICLE : Showed Resilience Near 50-Day Moving Average Following Sell-Off - 5/10/2023 |
View all notes |
Set NEW NOTE alert |
Company Profile |
SEC
News |
Chart |
Request a new note
C
A
S
I |
Symbol/Exchange
Company Name
Industry Group |
PRICE |
CHANGE
(%Change) |
Day High |
Volume
(% DAV)
(% 50 day avg vol) |
52 Wk Hi
% From Hi |
Featured
Date |
Price
Featured |
Pivot Featured |
|
Max Buy |
MTRN
-
NYSE
Materion
METALS and MINING - Industrial Metals and Minerals
|
$102.92
|
-0.72
-0.69% |
$106.42
|
78,325
74.60% of 50 DAV
50 DAV is 105,000
|
$121.29
-15.15%
|
4/18/2023
|
$114.52
|
PP = $118.30
|
|
MB = $124.22
|
Most Recent Note - 5/9/2023 6:54:29 PM
G - Fell with lighter volume after abruptly retreating on 5/04/23 for damaging loss with above-average volume as it again violated its 50 DMA line ($110.75) raising concerns. Disciplined investors may note that it did not quite produce a gain and a strong close above the pivot point backed by at least +40% above average volume to trigger a proper technical buy signal. Reported Mar '23 quarterly earnings +13% versus the year-ago period, below the +25% minimum guideline (C criteria) raising fundamental concerns. See the latest FSU analysis for more details and a new annotated graph.
>>> FEATURED STOCK ARTICLE : Materion Sputtering Below 50 DMA Line After Subpar Earnings - 5/9/2023 |
View all notes |
Set NEW NOTE alert |
Company Profile |
SEC
News |
Chart |
Request a new note
C
A
S
I |
SPSC
-
NASDAQ
SPS Commerce
COMPUTER SOFTWARE and SERVICES - Application Software
|
$158.54
|
+4.42
2.87% |
$159.65
|
138,234
91.55% of 50 DAV
50 DAV is 151,000
|
$157.46
0.69%
|
4/24/2023
|
$150.01
|
PP = $157.56
|
|
MB = $165.44
|
Most Recent Note - 5/10/2023 5:31:28 PM
Y - Hit a new 52-week high with today's 4th consecutive gain backed by average volume. Subsequent gains above the pivot point backed by at least +40% above average volume may trigger a technical buy signal. Reported Mar '23 quarterly earnings +22% on +20% versus the year-ago period, below the +25% minimum earnings guideline (C criteria) raising some fundamental concerns.
>>> FEATURED STOCK ARTICLE : Sputtered While Perched in Striking Distance of 52-Week HIgh - 4/24/2023 |
View all notes |
Set NEW NOTE alert |
Company Profile |
SEC
News |
Chart |
Request a new note
C
A
S
I |
HUBB
-
NYSE
Hubbell
Electrical-Power/Equipmt
|
$272.19
|
+1.27
0.47% |
$273.26
|
306,920
76.54% of 50 DAV
50 DAV is 401,000
|
$282.19
-3.54%
|
4/25/2023
|
$262.85
|
PP = $257.51
|
|
MB = $270.39
|
Most Recent Note - 5/9/2023 3:04:04 PM
G - Holding its ground near its all-time high with volume totals cooling. Bullish action came after its strong Mar '23 quarterly results. Prior highs in the $263 area define initial support to watch on pullbacks.
>>> FEATURED STOCK ARTICLE : Gap Up Following Earnings Triggered Technical Buy Signal - 4/25/2023 |
View all notes |
Set NEW NOTE alert |
Company Profile |
SEC
News |
Chart |
Request a new note
C
A
S
I |
NVR
-
NYSE
NVR Inc
MATERIALS and CONSTRUCTION - Residential Construction
|
$5,836.51
|
-38.94
-0.66% |
$5,933.78
|
20,497
89.12% of 50 DAV
50 DAV is 23,000
|
$5,986.96
-2.51%
|
4/25/2023
|
$5,882.18
|
PP = $5,978.25
|
|
MB = $6,277.16
|
Most Recent Note - 5/10/2023 5:53:37 PM
G - Still hovering near its all-time high with volume totals cooling. Reported Mar '23 quarterly earnings -14% on -3% sales revenues versus the year-ago period, below the +25% minimum earnings guideline (C criteria) raising fundamental concerns, and its color code was changed to green. Confirming gains and a close above the pivot point backed by at least +40% above average volume may clinch a proper technical buy signal. Prior quarterly comparisons were well above the +25% minimum earnings guideline (C criteria). Annual earnings (A criteria) growth has been very strong.
>>> FEATURED STOCK ARTICLE : Fell From High and Raised Concern With Subpar Mar '23 Report - 4/27/2023 |
View all notes |
Set NEW NOTE alert |
Company Profile |
SEC
News |
Chart |
Request a new note
C
A
S
I |
PHM
-
NYSE
PulteGroup
MATERIALS and CONSTRUCTION - Residential Construction
|
$67.80
|
+0.07
0.10% |
$68.52
|
3,006,038
99.44% of 50 DAV
50 DAV is 3,023,000
|
$68.73
-1.35%
|
4/25/2023
|
$65.17
|
PP = $64.01
|
|
MB = $67.21
|
Most Recent Note - 5/10/2023 5:59:32 PM
G - Perched at its all-time high and "max buy" level and its color code is changed to green. Reported earnings +28% for the Mar '23 quarter versus the year-ago period. Prior highs in the $64-60 area define initial support to watch above its 50 DMA line ($59.61).
>>> FEATURED STOCK ARTICLE : Recently Rallying to New All-Time Highs - 4/26/2023 |
View all notes |
Set NEW NOTE alert |
Company Profile |
SEC
News |
Chart |
Request a new note
C
A
S
I |
Symbol/Exchange
Company Name
Industry Group |
PRICE |
CHANGE
(%Change) |
Day High |
Volume
(% DAV)
(% 50 day avg vol) |
52 Wk Hi
% From Hi |
Featured
Date |
Price
Featured |
Pivot Featured |
|
Max Buy |
COKE
-
NASDAQ
Coca-Cola Consolidated
FOOD and BEVERAGE - Beverages - Soft Drinks
|
$629.92
|
+0.18
0.03% |
$649.50
|
34,276
95.21% of 50 DAV
50 DAV is 36,000
|
$694.20
-9.26%
|
5/4/2023
|
$646.66
|
PP = $656.21
|
|
MB = $689.02
|
Most Recent Note - 5/9/2023 3:09:26 PM
Y - Pulling back today for a 3rd consecutive loss, raising concerns while slumping back below the pivot point cited. Solid gain on 5/04/23 backed by +128% above average volume as it closed above the new pivot point cited based on its 6/07/22 high plus 10 cents triggered a technical buy signal. Bullish action came after it reported Mar '23 quarterly earnings +93% on +12% sales revenues versus the year-ago period, continuing its strong earnings track record.
>>> FEATURED STOCK ARTICLE : COKE is Showing Real Strength - 5/4/2023 |
View all notes |
Set NEW NOTE alert |
Company Profile |
SEC
News |
Chart |
Request a new note
C
A
S
I |
|
|
|
THESE ARE NOT BUY RECOMMENDATIONS!
Comments contained in the body of this report are technical
opinions only. The material herein has been obtained
from sources believed to be reliable and accurate, however,
its accuracy and completeness cannot be guaranteed.
This site is not an investment advisor, hence it does
not endorse or recommend any securities or other investments.
Any recommendation contained in this report may not
be suitable for all investors and it is not to be deemed
an offer or solicitation on our part with respect to
the purchase or sale of any securities. All trademarks,
service marks and trade names appearing in this report
are the property of their respective owners, and are
likewise used for identification purposes only.
This report is a service available
only to active Paid Premium Members.
You may opt-out of receiving report notifications
at any time. Questions or comments may be submitted
by writing to Premium Membership Services 665 S.E. 10 Street, Suite 201 Deerfield Beach, FL 33441-5634 or by calling 1-800-965-8307
or 954-785-1121.
|
|
|