You are not logged in.
This means you
CAN ONLY VIEW reports that were published prior to Thursday, April 17, 2025.
You
MUST UPGRADE YOUR MEMBERSHIP if you want to see any current reports.
AFTER MARKET UPDATE - MONDAY, AUGUST 14TH, 2023
Previous After Market Report Next After Market Report >>>
|
|
|
|
DOW |
+26.23 |
35,307.63 |
+0.07% |
|
Volume |
814,744,175 |
+8% |
|
Volume |
4,319,920,500 |
-7% |
|
NASDAQ |
+143.48 |
13,788.33 |
+1.05% |
|
Advancers |
1,148 |
40% |
|
Advancers |
1,811 |
41% |
|
S&P 500 |
+25.67 |
4,489.72 |
+0.58% |
|
Decliners |
1,694 |
60% |
|
Decliners |
2,602 |
59% |
|
Russell 2000 |
-4.62 |
1,920.49 |
-0.24% |
|
52 Wk Highs |
46 |
|
|
52 Wk Highs |
56 |
|
|
S&P 600 |
-6.54 |
1,237.11 |
-0.53% |
|
52 Wk Lows |
53 |
|
|
52 Wk Lows |
206 |
|
|
 |
Indices Rose Led by Tech-Heavy Nasdaq Composite
Kenneth J. Gruneisen - Passed the CAN SLIM® Master's Exam
The Nasdaq Composite Index outpaced the benchmark S&P 500 Index while the Dow Industrials posted a smaller gain. Volume totals reported were mixed, higher than the prior session on the NYSE and lighter on the Nasdaq exchange. Decliners led advancers by a 4-3 margin on the NYSE and by almost a 3-2 margin on the Nasdaq exchange. There were 31 high-ranked companies from the Leaders List that hit a new 52-week high and were listed on the BreakOuts Page, versus the total of 33 on the prior session. New 52-week lows outnumbered new 52-week highs on the NYSE and on the Nasdaq exchange. The major indices are in an uptrend that is under pressure (M criteria), Healthy leadership is crucial to any sustained rally. Appropriate new buying efforts may still be considered under the fact-based investment system. Greater caution may be necessary in the event of a more serious correction.
PICTURED: The S&P 500 Index posted a small gain finding support above its 50-day moving average (DMA) line.
Six of the 11 S&P 500 sectors closed flat with the utilities (-0.8%) and real estate (-0.5%) sectors registering the largest declines. The information technology sector (+1.9%) set a strong pace supported by NVIDIA (NVDA +7.09%) after an encouraging view from Morgan Stanley (MS -0.42%) in front of its earnings report next week.
Following news that Cleveland-Cliffs (CLF +8.8%) made a bid to acquire its steelmaking rival US Steel (X +36.8%) the materials sector (+0.2) rose. Gains followed in Steel Dynamics (STLD +5.2%) and Nucor (NUE +3.3%). Treasury yields settled higher, keeping some pressure on stocks. The 2-yr note yield rose eight basis points to 4.97% and the 10-yr note yield rose two basis points to 4.18%. The U.S. Dollar Index climbed 0.3% to 103.18.
|
 Kenneth J. Gruneisen started out as a licensed stockbroker in August 1987, a couple of months prior to the historic stock market crash that took the Dow Jones Industrial Average down -22.6% in a single day. He has published daily fact-based fundamental and technical analysis on high-ranked stocks online for two decades. Through FACTBASEDINVESTING.COM, Kenneth provides educational articles, news, market commentary, and other information regarding proven investment systems that work in good times and bad.
Comments contained in the body of this report are technical opinions only and are not necessarily those of Gruneisen Growth Corp. The material herein has been obtained from sources believed to be reliable and accurate, however, its accuracy and completeness cannot be guaranteed. Our firm, employees, and customers may effect transactions, including transactions contrary to any recommendation herein, or have positions in the securities mentioned herein or options with respect thereto. Any recommendation contained in this report may not be suitable for all investors and it is not to be deemed an offer or solicitation on our part with respect to the purchase or sale of any securities. |
|
 |
Semiconductor and Retail Indexes Led Group Gainersw
Kenneth J. Gruneisen - Passed the CAN SLIM® Master's Exam
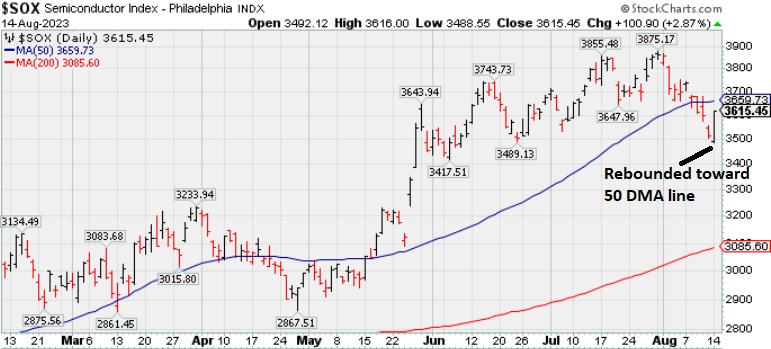
The Retail Index ($RLX +1.01%) posted a gain but weakness in the Bank Index ($BKX -1.66%) and the Broker/Dealer Index ($XBD -0.25%) created a drag on the major indices. The tech sector was led higher by the Semiconductor Index ($SOX +2.87%) while the Biotech Index ($BTK +0.49%) and the Networking Index ($NWX +0.46%) both posted smaller gains. Commodity-linked groups had a negative bias as the Gold & Silver Index ($XAU -1.41%), Integrated Oil Index ($XOI -0.70%), and the Oil Services Index ($OSX -1.10%) each lost ground.
PICTURED: The Semiconductor Index ($SOX +2.87%) posted a big gain, rebounding toward its 50-day moving average (DMA) line.
| Oil Services |
$OSX |
93.47 |
-1.04 |
-1.10% |
+11.46% |
| Integrated Oil |
$XOI |
1,886.05 |
-13.29 |
-0.70% |
+5.53% |
| Semiconductor |
$SOX |
3,615.45 |
+100.90 |
+2.87% |
+42.78% |
| Networking |
$NWX |
800.74 |
+3.69 |
+0.46% |
+2.23% |
| Broker/Dealer |
$XBD |
496.37 |
-1.24 |
-0.25% |
+10.52% |
| Retail |
$RLX |
3,660.90 |
+36.56 |
+1.01% |
+32.93% |
| Gold & Silver |
$XAU |
117.60 |
-1.68 |
-1.41% |
-2.70% |
| Bank |
$BKX |
85.23 |
-1.44 |
-1.66% |
-15.49% |
| Biotech |
$BTK |
5,256.59 |
+23.60 |
+0.45% |
-0.46% |
|
|
|
 |
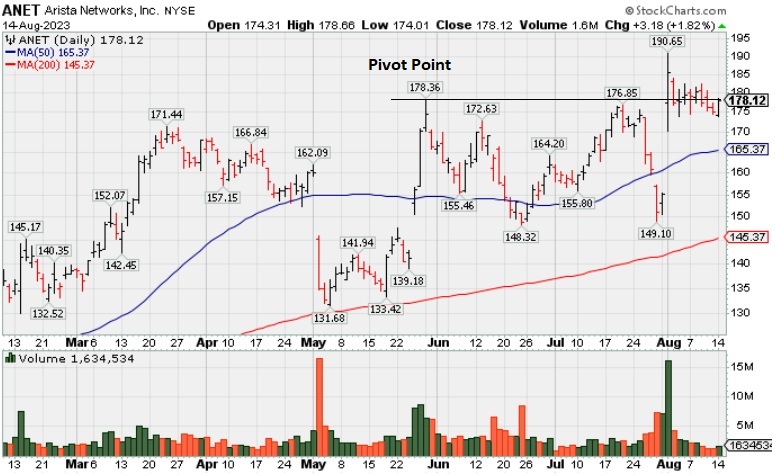
Hovering Near High with Volume Totals Cooling
Kenneth J. Gruneisen - Passed the CAN SLIM® Master's Exam
Arista Networks Inc (ANET +$3.18 or +1.82% or $178.12) has seen its volume totals cooling while hovering near the prior high and pivot point. Fundamentals remain strong. Bullish action came after it reported Jun '23 quarterly earnings +40% on +39% sales revenues versus the year-ago period. Its 50-day moving average (DMA) line ($165.37) defines near-term support.
ANET currently has a 98 Earnings Per Share Rating. It has shown 7 consecutive quarterly comparisons with strong and steady above the +25% minimum earnings guideline (C criteria). Annual earnings (A criteria) had a downturn in FY '20 like many companies during the pandemic.
The number of top-rated funds owning its shares rose from 1,758 in Dec '21 to 2,261 in Jun '23, a reassuring sign concerning the I criteria. Its current Up/Down Volume Ratio of 1.1 is an unbiased indication its shares have been nearly neutral concerning accumulation/distribution over the past 50 days. The high-ranked Computer - Networking firm has a Timeliness Rating of A and a Sponsorship Rating of C. Its small supply of 250.8 million shares (S criteria) in the public float may contribute to greater volatility in the event of institutional buying or selling.
|
|
|
Color Codes Explained :
Y - Better candidates highlighted by our
staff of experts.
G - Previously featured
in past reports as yellow but may no longer be buyable under the
guidelines.
***Last / Change / Volume data in this table is the closing quote data***
Symbol/Exchange
Company Name
Industry Group |
PRICE |
CHANGE
(%Change) |
Day High |
Volume
(% DAV)
(% 50 day avg vol) |
52 Wk Hi
% From Hi |
Featured
Date |
Price
Featured |
Pivot Featured |
|
Max Buy |
 STRL
-
NASDAQ
STRL
-
NASDAQ
Sterling Infrastructure
Bldg-Heavy Construction
|
$80.14
|
-0.65
-0.80% |
$81.55
|
449,955
115.08% of 50 DAV
50 DAV is 391,000
|
$82.32
-2.65%
|
12/14/2022
|
$32.41
|
PP = $33.72
|
|
MB = $35.41
|
Most Recent Note - 8/9/2023 5:15:08 PM
G - A 3rd consecutive volume-driven gain for another new all-time high leaves it very extended from any sound base. Bullish action came after it reported Jun '23 quarterly earnings +37% on +13% sales revenues versus the year-ago period, a solid increase after the Mar '23 earnings were below the +25% minimum guideline (C criteria). See the latest FSU analysis for more details and a new annotated graph.
>>> FEATURED STOCK ARTICLE : Volume-Driven Gains Leave Construction Firm at All-Time High - 8/9/2023 |
View all notes |
Set NEW NOTE alert |
Company Profile |
SEC
News |
Chart |
Request a new note
C
A
S
I |
FIX
-
NYSE
Comfort Systems USA
Bldg-A/C and Heating Prds
|
$177.85
|
-0.18
-0.10% |
$180.11
|
162,970
74.08% of 50 DAV
50 DAV is 220,000
|
$182.94
-2.78%
|
4/27/2023
|
$148.85
|
PP = $152.23
|
|
MB = $159.84
|
 Most Recent Note - 8/14/2023 5:56:20 PM
G - Holding its ground near its all-time high, extended from any sound base. Its 50 DMA line ($166) defines important near-term support to watch on pullbacks. Reported Jun '23 quarterly earnings +65% on +27% versus the year-ago period.
>>> FEATURED STOCK ARTICLE : Pulled Back From High With Lighter Volume - 7/19/2023 |
View all notes |
Set NEW NOTE alert |
Company Profile |
SEC
News |
Chart |
Request a new note
C
A
S
I |
KOF
-
NYSE
Coca-Cola Femsa ADR
Beverages-Non-Alcoholic
|
$82.81
|
+0.17
0.21% |
$83.40
|
313,379
210.32% of 50 DAV
50 DAV is 149,000
|
$91.23
-9.23%
|
6/9/2023
|
$88.61
|
PP = $91.33
|
|
MB = $95.90
|
Most Recent Note - 8/14/2023 6:01:39 PM
G - Posted a small gain today with +110% above average volume. A rebound above the 50 DMA line ($84.31) is still needed for its outlook to improve but that short-term average recently has acted as resistance. Its Relative Strength Rating is currently 81. Reported Jun '23 quarterly earnings +23% on +26% sales revenues versus the year-ago period, below the +25% minimum guideline (C criteria).
>>> FEATURED STOCK ARTICLE : 50-Day Moving Average Line has Acted as Resistance - 8/10/2023 |
View all notes |
Set NEW NOTE alert |
Company Profile |
SEC
News |
Chart |
Request a new note
C
A
S
I |
CLH
-
NYSE
Clean Harbors
Pollution Control
|
$177.72
|
+2.99
1.71% |
$178.33
|
272,499
69.34% of 50 DAV
50 DAV is 393,000
|
$176.63
0.62%
|
3/10/2023
|
$136.89
|
PP = $136.74
|
|
MB = $143.58
|
Most Recent Note - 8/9/2023 5:26:58 PM
G - Hit yet another new all-time high with today's 3rd consecutive gain. Its 50 DMA line ($161.60) defines important near-term support to watch on pullbacks. Reported earnings for the Jun '23 quarter -13% on +3% sales revenues versus the year-ago period, below the +25% minimum earnings guideline (C criteria), raising fundamental concerns.
>>> FEATURED STOCK ARTICLE : Negative Reversal at High After +26% Rally in 4 Months - 7/18/2023 |
View all notes |
Set NEW NOTE alert |
Company Profile |
SEC
News |
Chart |
Request a new note
C
A
S
I |
HUBB
-
NYSE
Hubbell
Electrical-Power/Equipmt
|
$310.43
|
+3.47
1.13% |
$311.67
|
409,895
95.55% of 50 DAV
50 DAV is 429,000
|
$340.06
-8.71%
|
4/25/2023
|
$262.85
|
PP = $257.51
|
|
MB = $270.39
|
Most Recent Note - 8/9/2023 5:28:25 PM
G - Still lingering below its 50 DMA line ($317). A rebound above the 50 DMA line is needed for its outlook to improve. Fundamentals remain strong after Jun '23 earnings rose +45% on +9% sales revenues versus the year-ago period.
>>> FEATURED STOCK ARTICLE : Pulled Back Undercutting 50 Day Moving Average Line - 7/26/2023 |
View all notes |
Set NEW NOTE alert |
Company Profile |
SEC
News |
Chart |
Request a new note
C
A
S
I |
Symbol/Exchange
Company Name
Industry Group |
PRICE |
CHANGE
(%Change) |
Day High |
Volume
(% DAV)
(% 50 day avg vol) |
52 Wk Hi
% From Hi |
Featured
Date |
Price
Featured |
Pivot Featured |
|
Max Buy |
NVR
-
NYSE
NVR
Bldg-Resident/Comml
|
$6,158.70
|
+1.97
0.03% |
$6,164.40
|
8,612
43.06% of 50 DAV
50 DAV is 20,000
|
$6,474.53
-4.88%
|
4/25/2023
|
$5,882.18
|
PP = $5,978.25
|
|
MB = $6,277.16
|
Most Recent Note - 8/10/2023 6:25:14 PM
G - Reported Jun '23 quarterly earnings -6% on -13% sales revenues, its 2nd subpar quarter, raising greater fundamental concerns. Undercut its 50 DMA line ($6,143) triggering a technical sell signal with today's 3rd consecutive loss backed by light volume.
>>> FEATURED STOCK ARTICLE : Consolidating Above 50 DMA After 2nd Subpar Earnings Report - 8/7/2023 |
View all notes |
Set NEW NOTE alert |
Company Profile |
SEC
News |
Chart |
Request a new note
C
A
S
I |
PHM
-
NYSE
PulteGroup
Bldg-Resident/Comml
|
$84.04
|
+1.27
1.53% |
$84.08
|
1,671,713
64.32% of 50 DAV
50 DAV is 2,599,000
|
$86.16
-2.46%
|
4/25/2023
|
$65.17
|
PP = $64.01
|
|
MB = $67.21
|
Most Recent Note - 8/10/2023 6:26:44 PM
G - Pulled back from its high with today's 2nd loss with below-average volume. It is very extended from any sound base. Recently reported earnings +18% for the Jun '23 quarter versus the year-ago period, below the +25% minimum guideline (C criteria) raising concerns. Its 50 DMA line ($77.88) defines important support to watch.
>>> FEATURED STOCK ARTICLE : Reversed After Reaching a New All-Time High - 7/27/2023 |
View all notes |
Set NEW NOTE alert |
Company Profile |
SEC
News |
Chart |
Request a new note
C
A
S
I |
AMPH
-
NASDAQ
Amphastar Pharm
Medical-Biomed/Biotech
|
$54.07
|
-0.62
-1.13% |
$54.82
|
371,469
79.89% of 50 DAV
50 DAV is 465,000
|
$67.66
-20.09%
|
5/15/2023
|
$43.56
|
PP = $44.15
|
|
MB = $46.36
|
Most Recent Note - 8/10/2023 6:18:51 PM
G - Suffered a damaging volume-driven loss today violating its 50 DMA line ($55.85) triggering a technical sell signal following a noted "negative reversal" on the prior session after hitting a new all-time high. Fundamentals remain strong after it reported Jun '23 quarterly earnings +67% on +18% sales revenues versus the year-ago period.
>>> FEATURED STOCK ARTICLE : 6th Straight Gain for Amphastar - 7/20/2023 |
View all notes |
Set NEW NOTE alert |
Company Profile |
SEC
News |
Chart |
Request a new note
C
A
S
I |
ANET
-
NYSE
Arista Networks
Computer-Networking
|
$178.12
|
+3.18
1.82% |
$178.66
|
1,660,808
50.80% of 50 DAV
50 DAV is 3,269,000
|
$190.65
-6.57%
|
8/1/2023
|
$188.84
|
PP = $178.46
|
|
MB = $187.38
|
Most Recent Note - 8/14/2023 5:53:20 PM
Y - Posted a gain today with light volume. Volume totals have been cooling while hovering near the prior high and pivot point. Bullish action came after it reported Jun '23 quarterly earnings +40% on +39% sales revenues versus the year-ago period. See the latest FSU analysis for more details and a new annotated graph.
>>> FEATURED STOCK ARTICLE : Hovering Near High with Volume Totals Cooling - 8/14/2023 |
View all notes |
Set NEW NOTE alert |
Company Profile |
SEC
News |
Chart |
Request a new note
C
A
S
I |
LSCC
-
NASDAQ
Lattice Semiconductor
Elec-Semicondctor Fablss
|
$88.33
|
+2.93
3.43% |
$88.42
|
1,482,734
80.28% of 50 DAV
50 DAV is 1,847,000
|
$98.18
-10.03%
|
6/13/2023
|
$91.73
|
PP = $96.92
|
|
MB = $101.77
|
Most Recent Note - 8/14/2023 6:04:07 PM
G - Posted a solid gain today rebounding toward its 50 DMA line ($89.50) which may act as resistance. Subsequent gains above the 50 DMA line are needed for its outlook to improve. Reported Jun '23 quarterly earnings +24% on +18% sales revenues versus the year-ago period, just below the +25% minimum earnings guideline (C criteria).
>>> FEATURED STOCK ARTICLE : Perched Near Pivot Point After Best-Ever Close - 7/17/2023 |
View all notes |
Set NEW NOTE alert |
Company Profile |
SEC
News |
Chart |
Request a new note
C
A
S
I |
Symbol/Exchange
Company Name
Industry Group |
PRICE |
CHANGE
(%Change) |
Day High |
Volume
(% DAV)
(% 50 day avg vol) |
52 Wk Hi
% From Hi |
Featured
Date |
Price
Featured |
Pivot Featured |
|
Max Buy |
XPEL
-
NASDAQ
XPEL
Auto/Truck-Replace Parts
|
$84.76
|
+1.51
1.81% |
$85.30
|
112,169
84.34% of 50 DAV
50 DAV is 133,000
|
$87.46
-3.09%
|
6/28/2023
|
$83.14
|
PP = $87.11
|
|
MB = $91.47
|
Most Recent Note - 8/11/2023 5:17:11 PM
G - Posted another solid gain today, promptly rebounding well above its 50 DMA line ($80.27), showing resilience after triggering a technical sell signal on 8/09/23. Faces little resistance due to overhead supply up to the $87 level. Reported Jun '23 quarterly earnings +33% on +22% sales revenues versus the year-ago period. Volume and volatility often increase near earnings news.
>>> FEATURED STOCK ARTICLE : Consolidating After Rebounding Above 50-Day Moving Average - 8/2/2023 |
View all notes |
Set NEW NOTE alert |
Company Profile |
SEC
News |
Chart |
Request a new note
C
A
S
I |
PII
-
NYSE
Polaris Industries Inc
AUTOMOTIVE - Recreational Vehicles
|
$123.70
|
-0.62
-0.50% |
$123.74
|
442,504
72.36% of 50 DAV
50 DAV is 611,500
|
$138.49
-10.68%
|
7/11/2023
|
$126.92
|
PP = $123.97
|
|
MB = $130.17
|
Most Recent Note - 8/11/2023 5:11:06 PM
G - Pulled back today for a 7th consecutive loss with below-average volume and undercut its 50 DMA line ($124.65) raising concerns. Recently reported Jun '23 quarterly earnings +0% versus the year-ago period, below the +25% minimum earnings guideline (C criteria). See the latest FSU analysis for more details and a new annotated graph.
>>> FEATURED STOCK ARTICLE : Quiet Pullback Undercut 50-Day Moving Average Line - 8/11/2023 |
View all notes |
Set NEW NOTE alert |
Company Profile |
SEC
News |
Chart |
Request a new note
C
A
S
I |
ESQ
-
NASDAQ
Esquire Finl Hldgs
Finance-Commercial Loans
|
$49.58
|
-0.59
-1.17% |
$50.17
|
12,380
42.69% of 50 DAV
50 DAV is 29,000
|
$54.03
-8.24%
|
7/14/2023
|
$45.80
|
PP = $48.23
|
|
MB = $50.64
|
Most Recent Note - 8/14/2023 5:55:12 PM
Y - Color code is changed to yellow after quietly pulling back below its "max buy" level. Prior highs in the $47 define important near-term support coinciding with its 50 DMA line.
>>> FEATURED STOCK ARTICLE : Esquire Perched Near Prior Highs - 7/14/2023 |
View all notes |
Set NEW NOTE alert |
Company Profile |
SEC
News |
Chart |
Request a new note
C
A
S
I |
MEDP
-
NASDAQ
Medpace Holdings
Medical-Research Eqp/Svc
|
$265.62
|
-1.27
-0.48% |
$267.98
|
210,582
54.84% of 50 DAV
50 DAV is 384,000
|
$269.44
-1.42%
|
7/25/2023
|
$196.32
|
PP = $241.57
|
|
MB = $253.65
|
Most Recent Note - 8/14/2023 5:58:42 PM
G - Color code is changed to green while quietly perched above its "max buy" level near its all-time high. Prior highs in the $241 area define support to watch above its 50 DMA line ($239). Reported earnings increases above the +25% minimum earnings guideline (C criteria) in the past 5 quarterly comparisons through Jun '23.
>>> FEATURED STOCK ARTICLE : Medpace Posted a Solid Volume-Driven Gain for a New High - 7/25/2023 |
View all notes |
Set NEW NOTE alert |
Company Profile |
SEC
News |
Chart |
Request a new note
C
A
S
I |
COKE
-
NASDAQ
Coca-Cola Consolidated
Beverages-Non-Alcoholic
|
$720.82
|
-20.78
-2.80% |
$743.43
|
45,854
109.18% of 50 DAV
50 DAV is 42,000
|
$745.53
-3.31%
|
8/3/2023
|
$718.56
|
PP = $694.30
|
|
MB = $729.02
|
Most Recent Note - 8/11/2023 5:15:14 PM
G - Volume was below average behind today's gain for another new all-time high, rising above its "max buy" level and its color code is changed to green. Prior highs in the $693 area define initial support to watch on pullbacks. Fundamentals remain strong
>>> FEATURED STOCK ARTICLE : Powerful Breakout for COKE - 8/3/2023 |
View all notes |
Set NEW NOTE alert |
Company Profile |
SEC
News |
Chart |
Request a new note
C
A
S
I |
Symbol/Exchange
Company Name
Industry Group |
PRICE |
CHANGE
(%Change) |
Day High |
Volume
(% DAV)
(% 50 day avg vol) |
52 Wk Hi
% From Hi |
Featured
Date |
Price
Featured |
Pivot Featured |
|
Max Buy |
ACLS
-
NASDAQ
Axcelis Technologies
Elec-Semiconductor Equip
|
$170.39
|
+3.28
1.96% |
$170.65
|
354,056
64.02% of 50 DAV
50 DAV is 553,000
|
$201.00
-15.23%
|
8/4/2023
|
$181.59
|
PP = $201.10
|
|
MB = $211.16
|
Most Recent Note - 8/11/2023 5:12:58 PM
G - Slumped further below its 50 DMA line ($176.66) and below recent lows with yet another loss today backed by above-average volume. A prompt rebound above the 50 DMA line is needed for its outlook to improve. Fundamentals remain strong.
>>> FEATURED STOCK ARTICLE : Formed Ascending Base and Now Testing 50-Day Moving Average - 8/4/2023 |
View all notes |
Set NEW NOTE alert |
Company Profile |
SEC
News |
Chart |
Request a new note
C
A
S
I |
PLUS
-
NASDAQ
ePlus
Computer-Tech Services
|
$65.18
|
-1.03
-1.56% |
$66.19
|
121,332
103.70% of 50 DAV
50 DAV is 117,000
|
$75.90
-14.12%
|
8/8/2023
|
$67.60
|
PP = $62.92
|
|
MB = $66.07
|
Most Recent Note - 8/14/2023 6:00:05 PM
Y - Stubbornly holding its ground since a noted "breakaway gap" on 8/08/23 helped it hit a new all-time high with +202% above average volume triggering a technical buy signal. Reported earnings +42% on +25% sales revenues for the Jun '23 quarter versus the year ago period, its 3rd consecutive quarterly earnings increase above the +25% minimum guideline (C criteria) helping iot better match the winning models of the fact-based investment system. Annual earnings growth (A criteria) has been strong.
>>> FEATURED STOCK ARTICLE : ePLUS Gapped Up but Ended in Lower Half of Intra-Day Range - 8/8/2023 |
View all notes |
Set NEW NOTE alert |
Company Profile |
SEC
News |
Chart |
Request a new note
C
A
S
I |
|
|
|
THESE ARE NOT BUY RECOMMENDATIONS!
Comments contained in the body of this report are technical
opinions only. The material herein has been obtained
from sources believed to be reliable and accurate, however,
its accuracy and completeness cannot be guaranteed.
This site is not an investment advisor, hence it does
not endorse or recommend any securities or other investments.
Any recommendation contained in this report may not
be suitable for all investors and it is not to be deemed
an offer or solicitation on our part with respect to
the purchase or sale of any securities. All trademarks,
service marks and trade names appearing in this report
are the property of their respective owners, and are
likewise used for identification purposes only.
This report is a service available
only to active Paid Premium Members.
You may opt-out of receiving report notifications
at any time. Questions or comments may be submitted
by writing to Premium Membership Services 665 S.E. 10 Street, Suite 201 Deerfield Beach, FL 33441-5634 or by calling 1-800-965-8307
or 954-785-1121.
|
|
|