You are not logged in.
This means you
CAN ONLY VIEW reports that were published prior to Thursday, April 17, 2025.
You
MUST UPGRADE YOUR MEMBERSHIP if you want to see any current reports.
AFTER MARKET UPDATE - WEDNESDAY, JULY 21ST, 2021
Previous After Market Report Next After Market Report >>>
|
|
|
|
DOW |
+286.01 |
34,798.00 |
+0.83% |
|
Volume |
856,239,896 |
-20% |
|
Volume |
4,026,974,900 |
-12% |
|
NASDAQ |
+131.64 |
14,630.52 |
+0.91% |
|
Advancers |
2,395 |
74% |
|
Advancers |
3,239 |
75% |
|
S&P 500 |
+35.63 |
4,358.69 |
+0.82% |
|
Decliners |
841 |
26% |
|
Decliners |
1,081 |
25% |
|
Russell 2000 |
+39.74 |
2,234.04 |
+1.81% |
|
52 Wk Highs |
113 |
|
|
52 Wk Highs |
91 |
|
|
S&P 600 |
+22.60 |
1,332.98 |
+1.72% |
|
52 Wk Lows |
18 |
|
|
52 Wk Lows |
36 |
|
|
 |
Indices Rise With Greater Leadership
Kenneth J. Gruneisen - Passed the CAN SLIM® Master's Exam
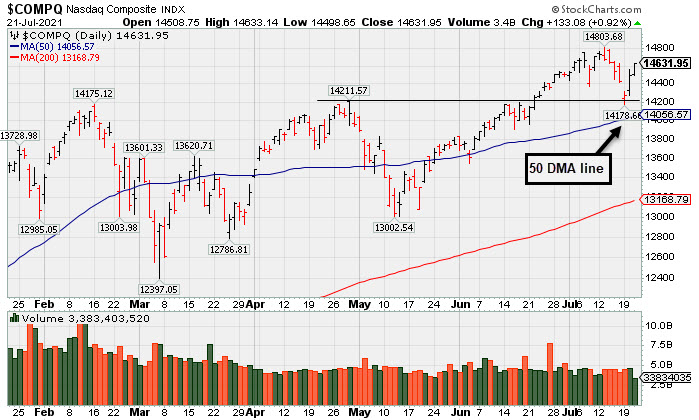
The S&P 500 gained 0.82%, the Dow jumped 0.83%, while the Nasdaq Composite was up 0.92%. All three benchmarks are now within 0.7% of their respective record highs last reached on July 12. The small-cap Russell 2000 surged 1.6% on the heels of its strongest single-session performance since March. The volume totals reported were lighter than the prior session on the NYSE and on the Nasdaq exchange. Breadth was positive as advancers led decliners by a 3-1 margin on the NYSE and on the Nasdaq exchange. Leadership improved as there were 44 high-ranked companies from the Leaders List that hit new 52-week highs and were listed on the BreakOuts Page, versus 35 on the prior session. New 52-week highs totals improved and outnumbered shrinking new 52-week lows on the NYSE and on the Nasdaq exchange. The major indices (M criteria) are in an uptrend that has come under pressure. Investors are reminded to always make buying and selling decisions on case-by-case basis under the strict criteria and rules of the fact-based investment system.
PICTURED: The Nasdaq Composite Index found support near the prior high, well above its 50-day moving average (DMA) line. More damaging losses would raise concerns.
U.S. stocks finished higher on Wednesday as strong corporate earnings reports helped bolster risk sentiment. Investors have emerged to “buy the dip” in equities after worries surrounding rising COVID-19 cases and corresponding economic growth concerns fueled a steep sell-off on Monday.
Eight of 11 S&P 500 sectors closed in positive territory, with Energy shares pacing gains amid a rebound in oil prices. Financials also outperformed as Treasury yields backed up. In earnings, Netflix (NFLX -3.3%) fell following a disappointing current-quarter subscriber growth forecast. Coca-Cola (KO +1.3%) rose as its revenue soared past Wall Street estimates, helped by the reopening of entertainment venues. Chipotle Mexican Grill (CMG +11%) hit a record high after its comparable sales figure surpassed analyst forecasts. Meanwhile, United Airlines (UAL +3.8%) rose on a top line beat and solid current-quarter projections.
Treasuries gave back this week’s gains, with the yield on the 10-year note up seven basis points to 1.29%, and the 30-year bond yield advancing six basis points to 1.94%. In commodities, WTI crude climbed 4.5% to $70.21/barrel despite government data unexpectedly showing the first weekly buildup in U.S. crude stockpiles since May. |
 Kenneth J. Gruneisen started out as a licensed stockbroker in August 1987, a couple of months prior to the historic stock market crash that took the Dow Jones Industrial Average down -22.6% in a single day. He has published daily fact-based fundamental and technical analysis on high-ranked stocks online for two decades. Through FACTBASEDINVESTING.COM, Kenneth provides educational articles, news, market commentary, and other information regarding proven investment systems that work in good times and bad.
Comments contained in the body of this report are technical opinions only and are not necessarily those of Gruneisen Growth Corp. The material herein has been obtained from sources believed to be reliable and accurate, however, its accuracy and completeness cannot be guaranteed. Our firm, employees, and customers may effect transactions, including transactions contrary to any recommendation herein, or have positions in the securities mentioned herein or options with respect thereto. Any recommendation contained in this report may not be suitable for all investors and it is not to be deemed an offer or solicitation on our part with respect to the purchase or sale of any securities. |
|
 |
Financial, Tech, and Commodity-linked Groups Rose
Kenneth J. Gruneisen - Passed the CAN SLIM® Master's Exam
The Broker/Dealer Index ($XBD +1.94%) and Bank Index ($BKX +2.06%) outpaced the Retail Index ($RLX +0.40%). Commodity-linked groups posted gains as the Oil Services Index ($OSX +4.83%) and Integrated Oil Index ($XOI +3.76%) outpaced the Gold & Silver Index ($XAU +1.94%). The Semiconductor Index ($SOX +2.98%) and Networking Index ($NWX +1.17%) rose but the Biotech Index ($BTK -0.08%) finished flat
PICTURED: The Retail Index ($RLX +0.40%) found support near the prior high and above its 50-day moving average (DMA) line.
| Oil Services |
$OSX |
57.21 |
+2.64 |
+4.83% |
+29.06% |
| Integrated Oil |
$XOI |
1,017.44 |
+36.88 |
+3.76% |
+28.39% |
| Semiconductor |
$SOX |
3,286.14 |
+95.19 |
+2.98% |
+17.55% |
| Networking |
$NWX |
847.35 |
+9.78 |
+1.17% |
+18.16% |
| Broker/Dealer |
$XBD |
461.82 |
+8.78 |
+1.94% |
+22.31% |
| Retail |
$RLX |
4,111.57 |
+16.46 |
+0.40% |
+15.39% |
| Gold & Silver |
$XAU |
137.76 |
+2.62 |
+1.94% |
-4.46% |
| Bank |
$BKX |
123.03 |
+2.48 |
+2.06% |
+25.65% |
| Biotech |
$BTK |
5,741.06 |
-4.83 |
-0.08% |
+0.04% |
|
|
|
 |
New Base Formed May Be "Late Stage"
Kenneth J. Gruneisen - Passed the CAN SLIM® Master's Exam
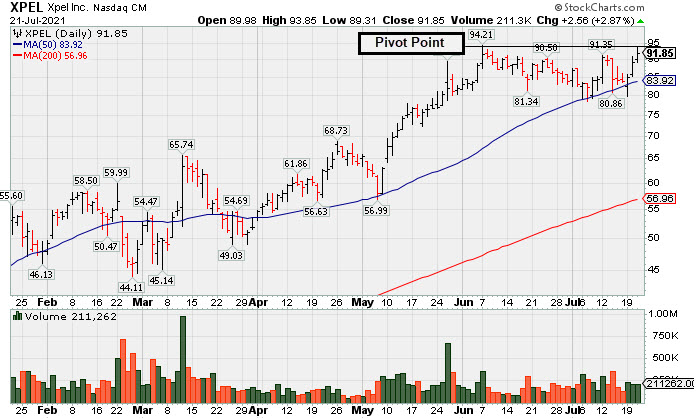
Xpel Inc (XPEL +2.56 or +2.87% to $91.85) was highlighted in yellow with pivot point cited based on its 6/07/21 high plus 10 cents in the earlier mid-day report (read here). Its 6-week consolidation has the look of a riskier "late-stage" base while challenging its all-time high after finding prompt support again at its 50 DMA line ($83.91).
It has a 95 Earnings Per Share Rating. It reported Mar '21 quarterly earnings +317% on +83% sales revenues versus the year ago period, adding to its strong earnings track record. Showed resilience and impressive strength after dropped from the Featured Stocks list on 3/29/21. It was last shown in this FSU section on 3/11/21 under the headline, "Powerful Breakout Backed by Heavy Volume".
This Auto/Truck - Replacement Parts firm reported Dec '20 quarterly earnings +29% on +0% sales revenues versus the year ago period, marking the 3rd quarterly comparison above the +25% minimum earnings guideline (C criteria). Annual earnings history has been strong after a downturn in FY '17.
The number of top-rated funds owning its shares rose from 45 in Mar '20 to 219 in Jun '21, a reassuring sign concerning the I criteria. Its current Up/Down Volume Ratio of 1.6 is an unbiased indication its shares have been under accumulation over the past 50 days. Its small supply of only 27.6 million shares outstanding (S criteria) can contribute to greater volatility in the event of institutional buying or selling. |
|
|
Color Codes Explained :
Y - Better candidates highlighted by our
staff of experts.
G - Previously featured
in past reports as yellow but may no longer be buyable under the
guidelines.
***Last / Change / Volume data in this table is the closing quote data***
Symbol/Exchange
Company Name
Industry Group |
PRICE |
CHANGE
(%Change) |
Day High |
Volume
(% DAV)
(% 50 day avg vol) |
52 Wk Hi
% From Hi |
Featured
Date |
Price
Featured |
Pivot Featured |
|
Max Buy |
 SIVB
-
NASDAQ
SIVB
-
NASDAQ
S V B Financial Group
BANKING - Regional - Pacific Banks
|
$574.00
|
+12.35
2.20% |
$577.70
|
246,675
64.57% of 50 DAV
50 DAV is 382,000
|
$608.84
-5.72%
|
4/23/2021
|
$579.70
|
PP = $577.16
|
|
MB = $606.02
|
Most Recent Note - 7/20/2021 5:20:09 PM
G - Posted a big gain today but remains below its 50 DMA line ($568.47). Only a prompt rebound above the 50 DMA line would help its outlook improve.
>>> FEATURED STOCK ARTICLE : Consolidating Near 50-Day Average After Distributional Pressure - 6/25/2021 |
View all notes |
Set NEW NOTE alert |
Company Profile |
SEC
News |
Chart |
Request a new note
C
A
S
I |
LOGI
-
NASDAQ
Logitech Intl Sa
COMPUTER HARDWARE - Computer Peripherals
|
$121.18
|
+3.15
2.67% |
$121.45
|
539,321
69.36% of 50 DAV
50 DAV is 777,600
|
$140.71
-13.88%
|
5/26/2021
|
$119.13
|
PP = $120.34
|
|
MB = $126.36
|
 Most Recent Note - 7/21/2021 2:16:35 PM
G - Posting a 3rd consecutive gain today with light volume rebounding near its 50 DMA line ($121.53). A prompt rebound and close above the 50 DMA line would help its outlook improve.
>>> FEATURED STOCK ARTICLE : Recent Pullback is Testing Important Technical Support - 7/2/2021 |
View all notes |
Set NEW NOTE alert |
Company Profile |
SEC
News |
Chart |
Request a new note
C
A
S
I |
CROX
-
NASDAQ
Crocs Inc
CONSUMER NON-DURABLES - Textile - Apparel Footwear
|
$119.98
|
+3.69
3.17% |
$120.33
|
1,257,885
88.21% of 50 DAV
50 DAV is 1,426,000
|
$120.92
-0.78%
|
6/14/2021
|
$112.64
|
PP = $110.01
|
|
MB = $115.51
|
Most Recent Note - 7/21/2021 5:44:39 PM
G - Posted a 3rd consecutive gain today challenging its all-time high with below average volume after finding support at its 50 DMA line ($108.52). More damaging losses would raise concerns and trigger a technical sell signal.
>>> FEATURED STOCK ARTICLE : Quietly Consolidating Below "Max Buy" Level - 7/7/2021 |
View all notes |
Set NEW NOTE alert |
Company Profile |
SEC
News |
Chart |
Request a new note
C
A
S
I |
CRL
-
NYSE
Charles River Labs Intl
DRUGS - Biotechnology
|
$385.77
|
+0.29
0.08% |
$386.08
|
206,822
30.64% of 50 DAV
50 DAV is 675,000
|
$386.57
-0.21%
|
6/9/2021
|
$345.91
|
PP = $349.23
|
|
MB = $366.69
|
Most Recent Note - 7/19/2021 5:43:10 PM
G - Volume totals have been below average while consolidating after wedging into record high territory. Prior highs in the $349 area and its 50 DMA line ($351) define near-term support to watch on pullbacks. Two of the past 3 quarterly comparisons through Mar '21 have been above the +25% minimum earnings guideline (C criteria).
>>> FEATURED STOCK ARTICLE : Volume Totals Cooling While Perched at High - 7/13/2021 |
View all notes |
Set NEW NOTE alert |
Company Profile |
SEC
News |
Chart |
Request a new note
C
A
S
I |
GNRC
-
NYSE
Generac Hldgs Inc
Electrical-Power/Equipmt
|
$447.34
|
+10.92
2.50% |
$448.45
|
589,412
75.86% of 50 DAV
50 DAV is 777,000
|
$452.92
-1.23%
|
6/8/2021
|
$348.46
|
PP = $342.38
|
|
MB = $359.50
|
Most Recent Note - 7/21/2021 2:13:45 PM
G - Perched near its all-time high, very extended from the previously noted base. Its 50 DMA line ($368) and prior high ($364) define important near-term support to watch on pullbacks. Fundamentals remain strong.
>>> FEATURED STOCK ARTICLE : Gain for New High Leaves GNRC Very Extended From Prior Base - 7/12/2021 |
View all notes |
Set NEW NOTE alert |
Company Profile |
SEC
News |
Chart |
Request a new note
C
A
S
I |
Symbol/Exchange
Company Name
Industry Group |
PRICE |
CHANGE
(%Change) |
Day High |
Volume
(% DAV)
(% 50 day avg vol) |
52 Wk Hi
% From Hi |
Featured
Date |
Price
Featured |
Pivot Featured |
|
Max Buy |
CAMT
-
NASDAQ
Camtek Ltd
ELECTRONICS - Scientific and Technical Instrum
|
$35.58
|
+0.78
2.24% |
$35.73
|
88,775
31.71% of 50 DAV
50 DAV is 280,000
|
$40.47
-12.08%
|
4/28/2021
|
$35.03
|
PP = $35.34
|
|
MB = $37.11
|
Most Recent Note - 7/20/2021 5:23:45 PM
G - Rebounded near its 50 DMA line ($34.82) with light volume behind today's gain. Subsequent gains above the 50 DMA line would help its outlook improve.
>>> FEATURED STOCK ARTICLE : Loss With Light Volume Undercut 50-Day Moving Average - 7/8/2021 |
View all notes |
Set NEW NOTE alert |
Company Profile |
SEC
News |
Chart |
Request a new note
C
A
S
I |
ASML
-
NASDAQ
A S M L Holding N.V. NY
ELECTRONICS - Semiconductor Equipment and Mate
|
$721.00
|
+36.95
5.40% |
$721.09
|
1,281,192
171.51% of 50 DAV
50 DAV is 747,000
|
$723.01
-0.28%
|
5/25/2021
|
$669.59
|
PP = $675.75
|
|
MB = $709.54
|
Most Recent Note - 7/21/2021 12:37:40 PM
Y - A gain and strong close backed by at least +40% above average volume would be a reassuring sign of fresh institutional buying demand. Gapped up today challenging its "max buy" level and all-time high hit last week. Retested its 50 DMA line ($677.66) which defines important near-term support. More damaging losses would raise concerns and trigger technical sell signals.
>>> FEATURED STOCK ARTICLE : Volume Higher While Pulling Back Toward 50-Day Moving Average - 7/1/2021 |
View all notes |
Set NEW NOTE alert |
Company Profile |
SEC
News |
Chart |
Request a new note
C
A
S
I |
POOL
-
NASDAQ
Pool Corp
WHOLESALE - Basic Materials Wholesale
|
$457.69
|
+5.18
1.14% |
$457.69
|
275,011
107.85% of 50 DAV
50 DAV is 255,000
|
$478.67
-4.38%
|
6/21/2021
|
$455.09
|
PP = $449.54
|
|
MB = $472.02
|
Most Recent Note - 7/19/2021 5:51:12 PM
Y - Color code is changed to yellow after today's 6th consecutive loss tested prior highs in the $449-444 range and its 50 DMA line ($446) which define important support. More damaging losses would raise concerns and trigger a technical sell signal.
>>> FEATURED STOCK ARTICLE : Volume-Driven Breakout After Orderly Consolidation - 6/21/2021 |
View all notes |
Set NEW NOTE alert |
Company Profile |
SEC
News |
Chart |
Request a new note
C
A
S
I |
FSBW
-
NASDAQ
F S Bancorp
Banks-West/Southwest
|
$35.43
|
-0.16
-0.45% |
$36.54
|
16,390
52.87% of 50 DAV
50 DAV is 31,000
|
$36.85
-3.85%
|
5/18/2021
|
$35.08
|
PP = $36.85
|
|
MB = $38.69
|
Most Recent Note - 7/20/2021 5:16:51 PM
Y - Color code is changed to yellow after promptly rebounding above its 50 DMA line ($35.14) with today's big gain helping its outlook to improve. Subsequent gains above the pivot point backed by at least +40% above average volume are needed to trigger a technical buy signal. Do not be confused by a 2:1 stock split which impacted share prices as of 7/15/21 (Featured Price, Pivot Point, and Max Buy levels were updated accordingly).
>>> FEATURED STOCK ARTICLE : Still Consolidating With Close Striking Distance of All-Time High - 6/24/2021 |
View all notes |
Set NEW NOTE alert |
Company Profile |
SEC
News |
Chart |
Request a new note
C
A
S
I |
SMPL
-
NASDAQ
Simply Good Foods Co
Food-Confectionery
|
$37.15
|
+0.34
0.92% |
$37.34
|
331,664
59.01% of 50 DAV
50 DAV is 562,000
|
$38.50
-3.51%
|
12/28/2020
|
$30.40
|
PP = $31.44
|
|
MB = $33.01
|
Most Recent Note - 7/20/2021 5:27:36 PM
G - Stubbornly holding its ground near its all-time high. Its 50 DMA line ($35.40) and prior highs in the $35 area define important near-term support to watch on pullbacks. Reported May '21 quarterly earnings +65% on +32% sales revenues versus the year ago period, well above the +25% minimum earnings guideline (C criteria).
>>> FEATURED STOCK ARTICLE : Pulled Back from High With Small Losses on Light Volume - 7/15/2021 |
View all notes |
Set NEW NOTE alert |
Company Profile |
SEC
News |
Chart |
Request a new note
C
A
S
I |
Symbol/Exchange
Company Name
Industry Group |
PRICE |
CHANGE
(%Change) |
Day High |
Volume
(% DAV)
(% 50 day avg vol) |
52 Wk Hi
% From Hi |
Featured
Date |
Price
Featured |
Pivot Featured |
|
Max Buy |
SHOP
-
NYSE
Shopify Inc Cl A
Computer Sftwr-Enterprse
|
$1,569.36
|
+44.58
2.92% |
$1,569.36
|
1,328,209
94.74% of 50 DAV
50 DAV is 1,402,000
|
$1,587.74
-1.16%
|
7/2/2021
|
$1,468.00
|
PP = $1,552.23
|
|
MB = $1,629.84
|
Most Recent Note - 7/20/2021 5:18:55 PM
Y - Posted a solid gain today for its 2nd best ever close. A new pivot point was recently cited based on its 6/21/21 high while building on a cup-with-high-handle base. Confirming gains with at least +40% above average volume for new highs would trigger a new (or add-on) technical buy signal and be a reassuring sign of fresh institutional buying demand. See the latest FSU analysis for more details and an annotated graph.
>>> FEATURED STOCK ARTICLE : Managed a Positive Reversal After Early Weakness - 7/19/2021 |
View all notes |
Set NEW NOTE alert |
Company Profile |
SEC
News |
Chart |
Request a new note
C
A
S
I |
YETI
-
NYSE
Yeti Holdings Inc
Leisure-Products
|
$92.84
|
+1.04
1.13% |
$94.08
|
603,083
42.14% of 50 DAV
50 DAV is 1,431,000
|
$96.62
-3.91%
|
5/13/2021
|
$84.20
|
PP = $90.65
|
|
MB = $95.18
|
Most Recent Note - 7/20/2021 5:29:38 PM
Y - Color code is changed to yellow after today's gain allowed it to rebound and close above its 50 DMA line ($89.52) helping its outlook improve. More damaging losses would raise greater concerns. Fundamentals remain strong.
>>> FEATURED STOCK ARTICLE : Volume Totals Cooling While Consolidating Near High - 7/9/2021 |
View all notes |
Set NEW NOTE alert |
Company Profile |
SEC
News |
Chart |
Request a new note
C
A
S
I |
DOCU
-
NASDAQ
Docusign Inc
Computer Sftwr-Enterprse
|
$302.81
|
+1.54
0.51% |
$304.95
|
2,241,725
72.67% of 50 DAV
50 DAV is 3,085,000
|
$306.00
-1.04%
|
7/6/2021
|
$288.96
|
PP = $290.33
|
|
MB = $304.85
|
Most Recent Note - 7/20/2021 11:54:17 AM
Y - Posting a 4th consecutive gain today and hitting a new all-time high. Wedging into new high territory with gains in recent weeks lacking great volume conviction. Highlighted in yellow with pivot point cited based on its 9/02/20 high plus 10 cents. A gain and strong close above the pivot point cited backed by at least +40% above average volume may trigger a convincing new (or add-on) technical buy signal. Fundamentals remain strong after reporting very strong Apr '21 quarterly results.
>>> FEATURED STOCK ARTICLE : Touched New High With Average Volume Behind Today's Gain - 7/6/2021 |
View all notes |
Set NEW NOTE alert |
Company Profile |
SEC
News |
Chart |
Request a new note
C
A
S
I |
XPEL
-
NASDAQ
Xpel Inc
Auto/Truck-Tires andamp; Misc
|
$91.85
|
+2.56
2.87% |
$93.85
|
211,262
100.12% of 50 DAV
50 DAV is 211,000
|
$94.21
-2.51%
|
7/21/2021
|
$92.25
|
PP = $94.31
|
|
MB = $99.03
|
Most Recent Note - 7/21/2021 5:43:14 PM
Y - Color code was changed to yellow with pivot point cited based on its 6/07/21 high plus 10 cents. Its 6-week consolidation has the look of a riskier "late-stage" base while challenging its all-time high after finding prompt support again at its 50 DMA line ($83.91). Reported Mar '21 quarterly earnings +317% on +83% sales revenues versus the year ago period, adding to its strong earnings track record. Showed resilience and impressive strength after dropped from the Featured Stocks list on 3/29/21. See the latest FSU analysis for more details and a new annotated graph.
>>> FEATURED STOCK ARTICLE : New Base Formed May Be "Late Stage" - 7/21/2021 |
View all notes |
Set NEW NOTE alert |
Company Profile |
SEC
News |
Chart |
Request a new note
C
A
S
I |
JEF
-
NYSE
Jefferies Financial Grp
Finance-Invest Bnk/Bkrs
|
$33.53
|
+0.56
1.70% |
$33.81
|
1,882,591
84.23% of 50 DAV
50 DAV is 2,235,000
|
$35.69
-6.05%
|
6/28/2021
|
$31.81
|
PP = $34.42
|
|
MB = $36.14
|
Most Recent Note - 7/19/2021 5:54:21 PM
Y - Gapped down today testing its 50 DMA line ($32.08). More damaging losses would raise concerns and trigger a technical sell signal. As previously noted - "Subsequent gains above the pivot point backed by at least +40% above average volume are necessary to trigger a technical buy signal."
>>> FEATURED STOCK ARTICLE : High-Ranked Financial Firm Formed "Double Bottom" Base - 6/28/2021 |
View all notes |
Set NEW NOTE alert |
Company Profile |
SEC
News |
Chart |
Request a new note
C
A
S
I |
Symbol/Exchange
Company Name
Industry Group |
PRICE |
CHANGE
(%Change) |
Day High |
Volume
(% DAV)
(% 50 day avg vol) |
52 Wk Hi
% From Hi |
Featured
Date |
Price
Featured |
Pivot Featured |
|
Max Buy |
CLAR
-
NASDAQ
Clarus Corporation
Leisure-Products
|
$28.55
|
+0.80
2.88% |
$28.70
|
359,933
153.82% of 50 DAV
50 DAV is 234,000
|
$28.22
1.17%
|
5/12/2021
|
$21.40
|
PP = $19.73
|
|
MB = $20.72
|
Most Recent Note - 7/21/2021 12:38:42 PM
G - Hitting another new 52-week high today with a gain backed by above average volume. It did not form a sound base of sufficient length. Its 50 DMA line ($24.67) defines important near-term support to watch. See the latest FSU analysis for more details and an annotated graph.
>>> FEATURED STOCK ARTICLE : Extended From Prior Base and Hitting Another New High - 7/20/2021 |
View all notes |
Set NEW NOTE alert |
Company Profile |
SEC
News |
Chart |
Request a new note
C
A
S
I |
AVTR
-
NYSE
Avantor Inc
Medical-Research Eqp/Svc
|
$36.84
|
-0.31
-0.83% |
$37.30
|
3,644,519
93.33% of 50 DAV
50 DAV is 3,905,000
|
$37.35
-1.37%
|
6/10/2021
|
$32.94
|
PP = $34.09
|
|
MB = $35.79
|
Most Recent Note - 7/20/2021 5:21:50 PM
G - Posted a solid gain today for a new all-time high. Prior highs in the $33 area coincide with its 50 DMA line defining important support to watch on pullbacks.
>>> FEATURED STOCK ARTICLE : Held Ground But Made Little Price Progress Since Featured - 7/14/2021 |
View all notes |
Set NEW NOTE alert |
Company Profile |
SEC
News |
Chart |
Request a new note
C
A
S
I |
|
|
|
THESE ARE NOT BUY RECOMMENDATIONS!
Comments contained in the body of this report are technical
opinions only. The material herein has been obtained
from sources believed to be reliable and accurate, however,
its accuracy and completeness cannot be guaranteed.
This site is not an investment advisor, hence it does
not endorse or recommend any securities or other investments.
Any recommendation contained in this report may not
be suitable for all investors and it is not to be deemed
an offer or solicitation on our part with respect to
the purchase or sale of any securities. All trademarks,
service marks and trade names appearing in this report
are the property of their respective owners, and are
likewise used for identification purposes only.
This report is a service available
only to active Paid Premium Members.
You may opt-out of receiving report notifications
at any time. Questions or comments may be submitted
by writing to Premium Membership Services 665 S.E. 10 Street, Suite 201 Deerfield Beach, FL 33441-5634 or by calling 1-800-965-8307
or 954-785-1121.
|
|
|