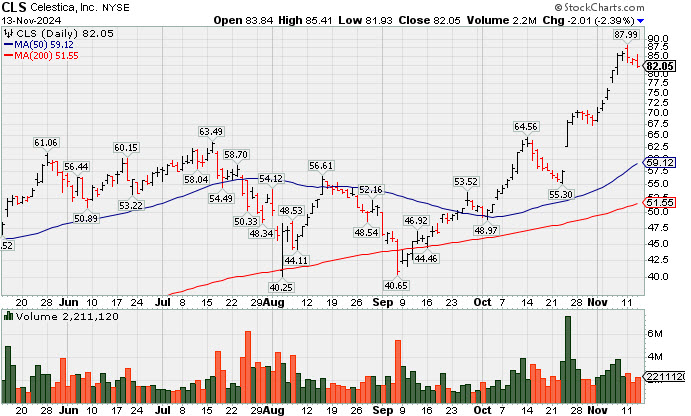
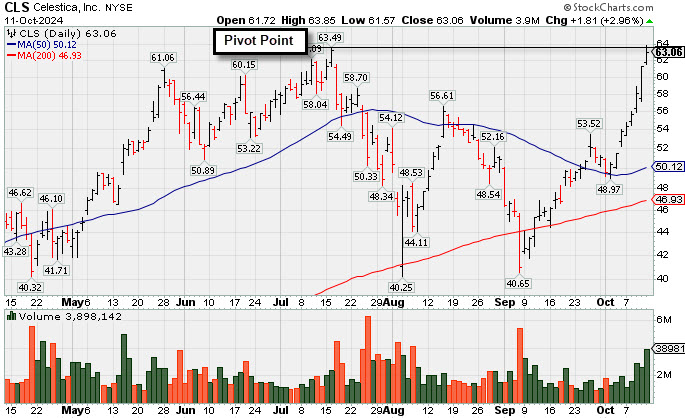
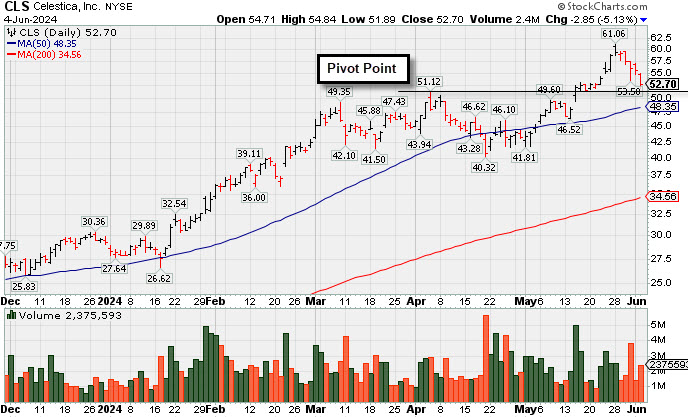
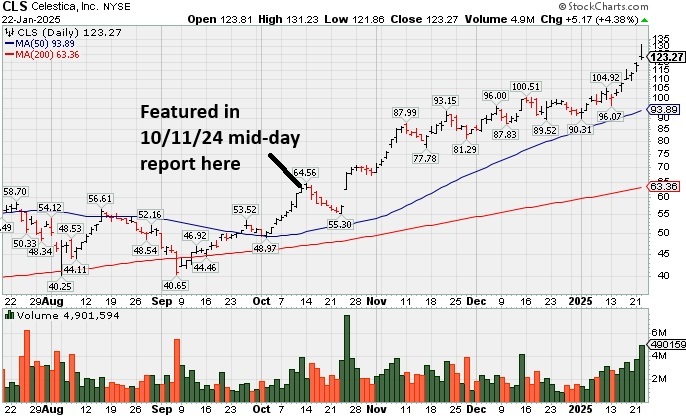
CLS was highlighted in yellow in the 10/11/24 mid-day report (read here) with new pivot point cited based on its 7/16/24 high plus 10 cents. It was last shown in detail in this FSU section on 11/13/24 with an annotated graph under the headline, "Pulling Back After Considerable Rally". It hails from the high ranked Elec-Contract Mfg group which is now ranked 25th on the 197 Industry Groups List (L criteria).
CLS has a highest possible 99 Earnings Per Share Rating. It reported earnings +60% on +22% sales revenues for the Sep '24 quarter versus the year ago period, and 9 of the last 10 quarterly comparisons were at or above the +25% minimum earnings guideline (C criteria). Annual earnings (A criteria) history has been strong since bottoming in FY '19.
There are only 116.4 million shares outstanding (S criteria) which can contribute to greater price volatility in the event of institutional buying or selling. The number of top-rated funds owning its shares rose from 322 in Jun '23 to 678 in Dec '24, a reassuring sign concerning the I criteria. Its current Up/Down Volume Ratio of 1.8 is an unbiased indication its shares have been under accumulation over the past 50 days.
Chart courtesy of www.stockcharts.com
| Symbol/Exchange Company Name Industry Group | PRICE | CHANGE | Day High | Volume (% DAV) (% 50 day avg vol) | 52 Wk Hi | Featured Date | Price Featured | Pivot Featured |
| Max Buy | ||||||||
Granite Construction Bldg-Heavy Construction | $94.08 | -0.73 -0.77% | $96.93 | 319,452 50 DAV is 550,000 | $105.20 -10.57% | 6/11/2024 | $59.76 | PP = $64.33 |
| MB = $67.55 | ||||||||
| Most Recent Note - 1/21/2025 3:48:20 PM G - Posting a 6th consecutive gain today rising above its 50 DMA line ($94) helping its outlook to improve. Slumped after a noted "negative reversal" at its all-time high. Reported Sep ''24 quarterly earnings +19% on +14% sales revenues versus the year-ago period, repeatedly noted as "below the +25% minimum guideline (C criteria) of the fact-based investment system." >>> FEATURED STOCK ARTICLE : Negative Reversal After Hitting New All-Time High - 12/6/2024 | View all notes | Set NEW NOTE alert | Company Profile | SEC News | Chart | Request a new note | ||||||||
Texas Roadhouse Inc LEISURE - Restaurants | $180.04 | -2.00 -1.10% | $182.62 | 679,572 50 DAV is 707,300 | $206.04 -12.62% | 7/26/2024 | $173.08 | PP = $175.82 |
| MB = $184.61 | ||||||||
| Most Recent Note - 1/17/2025 10:14:07 AM G - Recently finding support at its 200 DMA line ($173) but lingering below its 50 DMA line ($190) in recent weeks. A rebound above the 50 DMA line is still needed for its outlook to improve. >>> FEATURED STOCK ARTICLE : Hovering Near High After Recent Volume-driven Gains - 11/15/2024 | View all notes | Set NEW NOTE alert | Company Profile | SEC News | Chart | Request a new note | ||||||||
Howmet Aerospace Aerospace/Defense | $126.71 | -0.45 -0.35% | $128.33 | 2,598,267 50 DAV is 2,492,000 | $129.10 -1.85% | 1/8/2025 | $115.05 | PP = $120.81 |
| MB = $126.85 | ||||||||
Y - Paused today near its "max buy" level after 6 consecutive gains for new all-time highs. Recent volume-driven gains above the pivot point triggered a new (or add-on) technical buy signal. Found support recently above the prior high ($106.93 on 10/21/24). Fundamentals remain strong. >>> FEATURED STOCK ARTICLE : Extended From Prior Base and Perched at High - 12/5/2024 | View all notes | Set NEW NOTE alert | Company Profile | SEC News | Chart | Request a new note | ||||||||
Natural Grocers Retail-Super/Mini Mkts | $40.65 | -0.40 -0.97% | $41.72 | 88,331 50 DAV is 117,000 | $47.57 -14.55% | 11/5/2024 | $30.57 | PP = $30.42 |
| MB = $31.94 | ||||||||
| Most Recent Note - 1/21/2025 3:49:43 PM G - Gapped up today but retreated from its early high. Found support at its 50 DMA line ($40). More damaging losses would raise serious concerns and trigger a worrisome technical sell signal. Reported Sep ''24 quarterly earnings +50% on +9% sales revenues versus the year-ago period. >>> FEATURED STOCK ARTICLE : Consolidating After Considerable Rally to New Highs - 12/16/2024 | View all notes | Set NEW NOTE alert | Company Profile | SEC News | Chart | Request a new note | ||||||||
Celestica Elec-Contract Mfg | $123.27 | +5.17 4.38% | $131.23 | 4,837,470 50 DAV is 2,244,000 | $119.77 2.92% | 10/11/2024 | $57.62 | PP = $63.59 |
| MB = $66.77 | ||||||||
G - Extended from any sound base and hitting yet another new all-time high with today's 6th consecutive gain. Its 50 DMA line ($94) defines initial support to watch on pullbacks. >>> FEATURED STOCK ARTICLE : New High After 6th Consecutive Gain - 1/22/2025 | View all notes | Set NEW NOTE alert | Company Profile | SEC News | Chart | Request a new note | ||||||||
| Symbol/Exchange Company Name Industry Group | PRICE | CHANGE | Day High | Volume (% DAV) (% 50 day avg vol) | 52 Wk Hi | Featured Date | Price Featured | Pivot Featured |
| Max Buy | ||||||||
Paymentus Holdings Finance-CrdtCard/PmtPr | $31.24 | -0.01 -0.03% | $31.73 | 266,981 50 DAV is 537,000 | $38.94 -19.77% | 1/3/2025 | $34.21 | PP = $38.94 |
| MB = $40.89 | ||||||||
| Most Recent Note - 1/21/2025 3:43:48 PM G - Rebounding toward its 50 DMA line with today''s big gain after noted losses backed by above average volume. A rebound above the 50 DMA line ($33.37) is needed for its outlook to improve. >>> FEATURED STOCK ARTICLE : Losses Below 50-Day Moving Average Hurt Outlook - 1/8/2025 | View all notes | Set NEW NOTE alert | Company Profile | SEC News | Chart | Request a new note | ||||||||
ResMed Medical-Products | $247.33 | -0.46 -0.19% | $248.87 | 713,285 50 DAV is 780,000 | $260.49 -5.05% | 10/25/2024 | $256.64 | PP = $255.28 |
| MB = $268.04 | ||||||||
| Most Recent Note - 1/21/2025 3:45:22 PM Y - Gapped up today rebounding above its 50 DMA line ($239.49) helping its outlook to improve and its color code is changed to yellow. Its Relative Strength Rating is 83, at the 80+ minimum guideline for buy candidates. Faces near-term resistance due to overhead supply up to the $260 level. >>> FEATURED STOCK ARTICLE : Recent Slump Below 50-Day Moving Average Raised Concerns - 11/18/2024 | View all notes | Set NEW NOTE alert | Company Profile | SEC News | Chart | Request a new note | ||||||||
Adtalem Global Education Consumer Svcs-Education | $99.61 | +0.51 0.51% | $100.20 | 241,850 50 DAV is 396,000 | $100.05 -0.44% | 12/31/2024 | $91.50 | PP = $93.03 |
| MB = $97.68 | ||||||||
| Most Recent Note - 1/17/2025 10:06:48 AM G - After a noted "positive reversal" today''s 4th consecutive gain has it wedging to new all-time highs above its "max buy" level and its color code is changed to green. New pivot point was cited based on its 11/06/24 high plus 10 cents. It did not produce gains above its pivot point with heavy enough volume to trigger a proper new (or add-on) technical buy signal. Its 50 DMA line ($90.34) defines initial support above the prior low ($84.79 on 12/18/24). Fundamentals remain strong. >>> FEATURED STOCK ARTICLE : Hovering Near High With Volume Totals Cooling - 12/4/2024 | View all notes | Set NEW NOTE alert | Company Profile | SEC News | Chart | Request a new note | ||||||||
Tradeweb Markets Cl A Financial Svcs-Specialty | $128.57 | +0.66 0.52% | $129.06 | 1,133,893 50 DAV is 860,600 | $141.69 -9.26% | 11/19/2024 | $134.41 | PP = $136.23 |
| MB = $143.04 | ||||||||
G - Its Relative Strength Rating has slumped to 77, below the 80+ minimum guideline for buy candidates while lingering below its 50 DMA line. Prior lows in the $125 area define the next very important support level to watch. More damaging losses would raise serious concerns. A rebound above the 50 DMA line ($132) is needed for its outlook to improve and it must produce a volume-driven gain above the pivot point to trigger a proper technical buy signal. It was highlighted in yellow with pivot point cited based on its 10/15/24 high plus 10 cents. >>> FEATURED STOCK ARTICLE : Tradeweb Markets Perched Near High - 11/19/2024 | View all notes | Set NEW NOTE alert | Company Profile | SEC News | Chart | Request a new note | ||||||||
Atour Lifestyle Hldgs ADR Leisure-Lodging | $26.22 | -0.22 -0.83% | $26.65 | 471,578 50 DAV is 1,259,000 | $29.90 -12.31% | 12/9/2024 | $29.34 | PP = $29.25 |
| MB = $30.71 | ||||||||
| Most Recent Note - 1/17/2025 10:02:56 AM G - Still lingering below its 50 DMA line ($26.53) which may act as resistance. A rebound above the 50 DMA line is needed for its outlook to improve. >>> FEATURED STOCK ARTICLE : Volume Above Average Behind Breakout Gain - 12/9/2024 | View all notes | Set NEW NOTE alert | Company Profile | SEC News | Chart | Request a new note | ||||||||
| Symbol/Exchange Company Name Industry Group | PRICE | CHANGE | Day High | Volume (% DAV) (% 50 day avg vol) | 52 Wk Hi | Featured Date | Price Featured | Pivot Featured |
| Max Buy | ||||||||
CRA International Comml Svcs-Consulting | $184.08 | -1.87 -1.01% | $188.05 | 45,774 50 DAV is 34,000 | $210.70 -12.63% | 12/17/2024 | $208.34 | PP = $208.48 |
| MB = $218.90 | ||||||||
| Most Recent Note - 1/21/2025 3:46:41 PM G - Today''s gain with light volume has it rebounding toward its 50 DMA line which may act as resistance. A rebound above the 50 DMA line ($190) is needed for its outlook to improve. Its 200 DMA line ($174) defines important near-term support. Fundamentals remain strong. >>> FEATURED STOCK ARTICLE : Volume-Driven Gain for New High Triggered Technical Buy Signal - 12/17/2024 | View all notes | Set NEW NOTE alert | Company Profile | SEC News | Chart | Request a new note | ||||||||
Stride Consumer Svcs-Education | $117.49 | +0.95 0.82% | $118.58 | 727,992 50 DAV is 706,000 | $117.64 -0.13% | 1/10/2025 | $114.31 | PP = $112.90 |
| MB = $118.55 | ||||||||
Y - Posted a 5th consecutive gain today with lackluster volume, wedging above the pivot point cited based on its 12/04/24 high and hitting new all-time highs. Fundamentals remain strong. Recently consolidated in an orderly fashion above its 50 DMA line ($106.66). The 1/10/25 mid-day report noted - "A gain and strong close above the pivot point backed by at least +40% above average volume may clinch a technical buy signal." >>> FEATURED STOCK ARTICLE : Encountered Distributional Pressure Amid Broader Weakness - 1/10/2025 | View all notes | Set NEW NOTE alert | Company Profile | SEC News | Chart | Request a new note | ||||||||