You are not logged in.
This means you
CAN ONLY VIEW reports that were published prior to Thursday, April 17, 2025.
You
MUST UPGRADE YOUR MEMBERSHIP if you want to see any current reports.
AFTER MARKET UPDATE - FRIDAY, NOVEMBER 22ND, 2024
Previous After Market Report Next After Market Report >>>
|
|
|
|
DOW |
+426.16 |
44,296.51 |
+0.97% |
|
Volume |
973,176,837 |
+2% |
|
Volume |
6,831,520,000 |
-9% |
|
NASDAQ |
+31.23 |
19,003.65 |
+0.16% |
|
Advancers |
2,050 |
75% |
|
Advancers |
2,982 |
69% |
|
S&P 500 |
+20.63 |
5,969.34 |
+0.35% |
|
Decliners |
680 |
25% |
|
Decliners |
1,309 |
30% |
|
Russell 2000 |
+42.65 |
2,406.67 |
+1.80% |
|
52 Wk Highs |
281 |
|
|
52 Wk Highs |
283 |
|
|
S&P 600 |
+25.01 |
1,517.34 |
+1.68% |
|
52 Wk Lows |
24 |
|
|
52 Wk Lows |
88 |
|
|
 |
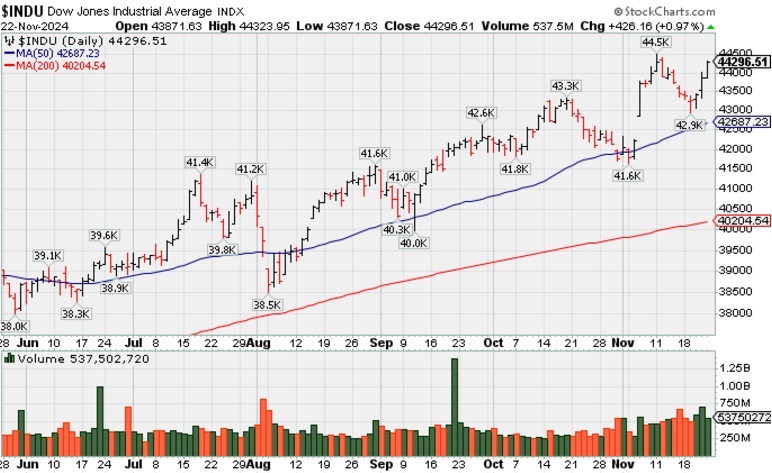
Major Indices Continued in Rally Mode
Kenneth J. Gruneisen - Passed the CAN SLIM® Master's Exam
The market-cap weighted S&P 500 settled +0.4% higher Volume totals reported were mixed, higher than the prior session total on the NYSE and lighter on the Nasdaq exchange. Advancers led decliners by a 3-1 margin on the NYSE and by more than a 2-1 margin on the Nasdaq exchange. Leadership expanded as there were 129 high-ranked companies from the Leaders List that hit new 52-week highs and were listed on the BreakOuts Page, versus the total of 104 on the prior session. New 52-week highs totals expanded and outnumbered shrinking new 52-week lows on the NYSE and on the Nasdaq exchange. The major indices are in a confirmed uptrend (M criteria). Disciplined investors know that new buying efforts are only to be made in stocks meeting all key criteria of the fact-based investment system.
PICTURED: The Nasdaq Composite Index was little changed on Thursday, lagging its peers.
Solid economic data underpinned the market. The U.S. S&P Global Services PMI for November showed an acceleration in services sector activity. Manufacturing PMI remained in contraction, but at a slower pace than in October. The final reading of the University of Michigan's Consumer Sentiment for November showed a dip to 71.8 from 73.0 in the preliminary reading, but it was still above October's final reading of 70.5.
Large-cap stocks underperformed the broader market, with capital rotating into small and mid-cap stocks, along with other sectors that have trailed mega cap performance. The broad buying activity lifted 25 of the 30 Dow components.
Eight of the 11 S&P 500 sectors rose. The consumer discretionary sector (+1.2%) was a top gainer while the communication services sector (-0.7%) was a laggard.
Ross Stores (ROST +2.2% and Gap (GAP +12.8%) both closed higher after reporting quarterly results. Companies related to Bitcoin outperformed as crypto market participants awaited Bitcoin’s potential move to the $100,000 milestone. Coinbase (COIN +3.2%) and MicroStrategy (MSTR +6.2%) were notable standouts in the space.
The 10-yr yield settled two basis points lower at 4.41% and the 2-yr yield settled two basis points higher at 4.37%.
|
 Kenneth J. Gruneisen started out as a licensed stockbroker in August 1987, a couple of months prior to the historic stock market crash that took the Dow Jones Industrial Average down -22.6% in a single day. He has published daily fact-based fundamental and technical analysis on high-ranked stocks online for two decades. Through FACTBASEDINVESTING.COM, Kenneth provides educational articles, news, market commentary, and other information regarding proven investment systems that work in good times and bad.
Comments contained in the body of this report are technical opinions only and are not necessarily those of Gruneisen Growth Corp. The material herein has been obtained from sources believed to be reliable and accurate, however, its accuracy and completeness cannot be guaranteed. Our firm, employees, and customers may effect transactions, including transactions contrary to any recommendation herein, or have positions in the securities mentioned herein or options with respect thereto. Any recommendation contained in this report may not be suitable for all investors and it is not to be deemed an offer or solicitation on our part with respect to the purchase or sale of any securities. |
|
 |
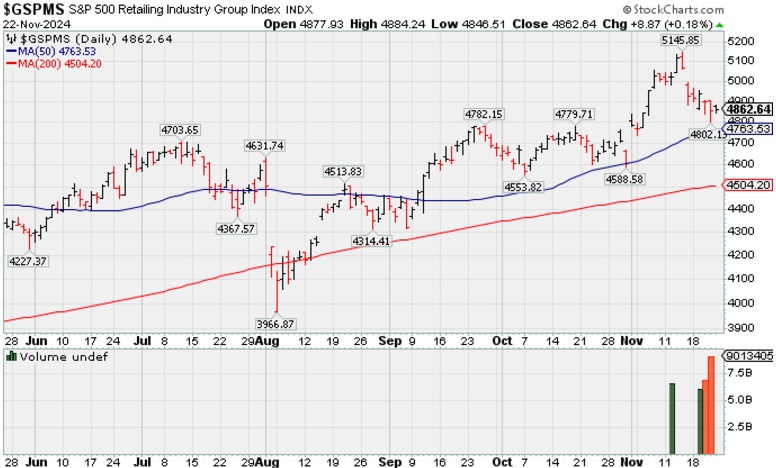
Bank, Biotech, Networking, and Oil Services Indexes Led Gainers
Kenneth J. Gruneisen - Passed the CAN SLIM® Master's Exam
The Bank Index ($BKX +1.56%) outpaced the Broker/Dealer Index ($XBD +0.15%) and the Retail Index ($RLX +0.18%). The tech sector was had a positive bias as the Networking Index ($NWX +2.07%) and the Biotech Index ($BTK +1.50%) posted solid gains, but the Semiconductor Index ($SOX -0.15%) sputtered. The Gold & Silver Index ($XAU +0.18%) and the Integrated Oil Index ($XOI +0.44%) edged higher and the Oil Services Index ($OSX +1.31%) posted a solid gain.
PICTURED: The Retail Index ($RLX +0.18%) posted a small gain.
| Oil Services |
$OSX |
81.23 |
+1.05 |
+1.31% |
-3.16% |
| Integrated Oil |
$XOI |
1,973.56 |
+8.59 |
+0.44% |
+5.96% |
| Semiconductor |
$SOX |
4,955.80 |
-7.26 |
-0.15% |
+18.69% |
| Networking |
$NWX |
1,197.19 |
+24.22 |
+2.07% |
+43.75% |
| Broker/Dealer |
$XBD |
848.27 |
+1.25 |
+0.15% |
+52.21% |
| Retail Index |
$RLX |
4,862.64 |
+8.87 |
+0.18% |
+25.04% |
| Gold & Silver |
$XAU |
153.69 |
+0.28 |
+0.18% |
+22.28% |
| Bank |
$BKX |
137.42 |
+2.11 |
+1.56% |
+43.12% |
| Biotech |
$BTK |
5,824.80 |
+86.28 |
+1.50% |
+7.49% |
|
|
|
 |
Featured Stocks
Kenneth J. Gruneisen - Passed the CAN SLIM® Master's Exam
|
|
|
Color Codes Explained :
Y - Better candidates highlighted by our
staff of experts.
G - Previously featured
in past reports as yellow but may no longer be buyable under the
guidelines.
***Last / Change / Volume data in this table is the closing quote data***
Symbol/Exchange
Company Name
Industry Group |
PRICE |
CHANGE
(%Change) |
Day High |
Volume
(% DAV)
(% 50 day avg vol) |
52 Wk Hi
% From Hi |
Featured
Date |
Price
Featured |
Pivot Featured |
|
Max Buy |
 USLM
-
NASDAQ
USLM
-
NASDAQ
U.S. Lime & Minerals
Bldg-Cement/Concrt/Ag
|
$149.73
|
-0.55
-0.37% |
$150.24
|
85,750
112.83% of 50 DAV
50 DAV is 76,000
|
$151.47
-1.15%
|
9/17/2024
|
$71.26
|
PP = $87.23
|
|
MB = $91.59
|
Most Recent Note - 11/21/2024 1:52:06 PM
G - Hitting yet another new all-time high with today's big gain. Held its ground stubbornly following a noted spurt of volume-driven gains. Its 50 DMA line ($109) defines important near-term support to watch on pullbacks.
>>> FEATURED STOCK ARTICLE : Extended From Any Sound Base After Impressive Rally - 11/12/2024 |
View all notes |
Set NEW NOTE alert |
Company Profile |
SEC
News |
Chart |
Request a new note
C
A
S
I |
GVA
-
NYSE
Granite Construction
Bldg-Heavy Construction
|
$99.29
|
+1.08
1.10% |
$99.72
|
334,035
47.58% of 50 DAV
50 DAV is 702,000
|
$99.32
-0.03%
|
6/11/2024
|
$59.76
|
PP = $64.33
|
|
MB = $67.55
|
Most Recent Note - 11/19/2024 3:46:29 PM
G - On track today for a 2nd consecutive gain with light volume. Perched near its all-time high, stubbornly holding its ground while very extended from any sound base. Bullish action has come after it reported Sep '24 quarterly earnings +19% on +14% sales revenues versus the year-ago period, below the +25% minimum guideline (C criteria) of the fact-based investment system.
>>> FEATURED STOCK ARTICLE : Extended From Base After Streak of Gains for New Highs - 11/8/2024 |
View all notes |
Set NEW NOTE alert |
Company Profile |
SEC
News |
Chart |
Request a new note
C
A
S
I |
TXRH
-
NASDAQ
Texas Roadhouse
Retail-Restaurants
|
$194.90
|
+2.34
1.22% |
$196.15
|
829,436
115.84% of 50 DAV
50 DAV is 716,000
|
$203.32
-4.14%
|
7/26/2024
|
$173.08
|
PP = $175.82
|
|
MB = $184.61
|
 Most Recent Note - 11/22/2024 1:19:24 PM
G - Pulled back from its all-time high with 6 consecutive small losses backed by below average volume. Its 50 DMA line ($183.49) and prior highs in the $177-180 area define important support to watch on pullbacks.
>>> FEATURED STOCK ARTICLE : Hovering Near High After Recent Volume-driven Gains - 11/15/2024 |
View all notes |
Set NEW NOTE alert |
Company Profile |
SEC
News |
Chart |
Request a new note
C
A
S
I |
HWM
-
NYSE
Howmet Aerospace
Aerospace/Defense
|
$118.44
|
+1.46
1.25% |
$118.80
|
5,093,495
221.17% of 50 DAV
50 DAV is 2,303,000
|
$119.28
-0.70%
|
7/30/2024
|
$93.95
|
PP = $85.52
|
|
MB = $89.80
|
Most Recent Note - 11/22/2024 12:27:53 PM
G - Hovering at its all-time high, extended from any sound base. Its prior high ($106.93 on 10/21/24) and 50 DMA line ($104.57) define near-term support levels to watch on pullbacks. Fundamentals remain strong.
>>> FEATURED STOCK ARTICLE : Found Support at 50-Day Moving Average Line Before Earnings Report - 11/5/2024 |
View all notes |
Set NEW NOTE alert |
Company Profile |
SEC
News |
Chart |
Request a new note
C
A
S
I |
NGVC
-
NYSE
Natural Grocers
Retail-Super/Mini Mkts
|
$45.60
|
+9.35
25.79% |
$45.61
|
405,026
430.88% of 50 DAV
50 DAV is 94,000
|
$36.29
25.65%
|
11/5/2024
|
$30.57
|
PP = $30.42
|
|
MB = $31.94
|
Most Recent Note - 11/22/2024 12:50:00 PM
G - Powering to a new all-time high with today's considerable gap up and volume-driven gain, getting very extended from any sound base. Bullish action came after it reported Sep '24 quarterly earnings +50% on +9% sales revenues versus the year-ago period. Prior high in the $30 area defines initial support to watch above its 50 DMA line.
>>> FEATURED STOCK ARTICLE : New High After 6th Consecutive Gain - 11/11/2024 |
View all notes |
Set NEW NOTE alert |
Company Profile |
SEC
News |
Chart |
Request a new note
C
A
S
I |
Symbol/Exchange
Company Name
Industry Group |
PRICE |
CHANGE
(%Change) |
Day High |
Volume
(% DAV)
(% 50 day avg vol) |
52 Wk Hi
% From Hi |
Featured
Date |
Price
Featured |
Pivot Featured |
|
Max Buy |
CLS
-
NYSE
Celestica
Elec-Contract Mfg
|
$89.16
|
-2.28
-2.49% |
$91.73
|
3,258,175
142.97% of 50 DAV
50 DAV is 2,279,000
|
$93.15
-4.28%
|
10/11/2024
|
$57.62
|
PP = $63.59
|
|
MB = $66.77
|
Most Recent Note - 11/21/2024 12:23:57 PM
G - Today's 4th consecutive gain has it hitting another new all-time high, very extended from any sound base. Its 50 DMA line ($64) and prior highs in the $63 area define initial support to watch on pullbacks.
>>> FEATURED STOCK ARTICLE : Pulling Back After Considerable Rally - 11/13/2024 |
View all notes |
Set NEW NOTE alert |
Company Profile |
SEC
News |
Chart |
Request a new note
C
A
S
I |
PAY
-
NYSE
Paymentus Holdings
Finance-CrdtCard/PmtPr
|
$36.44
|
+0.13
0.36% |
$36.97
|
309,851
95.05% of 50 DAV
50 DAV is 326,000
|
$37.00
-1.51%
|
10/17/2024
|
$26.15
|
PP = $25.31
|
|
MB = $26.58
|
Most Recent Note - 11/22/2024 1:21:44 PM
G - Extended from any sound base and stubbornly holding its ground perched at its 52-week high with volume totals cooling. Bullish action came after it reported Sep '24 quarterly earnings +67% on +52% sales revenues versus the year-ago period.
>>> FEATURED STOCK ARTICLE : Extended From Prior Base After Considerable Spike Higher - 11/14/2024 |
View all notes |
Set NEW NOTE alert |
Company Profile |
SEC
News |
Chart |
Request a new note
C
A
S
I |
RMD
-
NYSE
ResMed
Medical-Products
|
$243.78
|
+0.18
0.07% |
$243.89
|
551,442
52.67% of 50 DAV
50 DAV is 1,047,000
|
$260.49
-6.41%
|
10/25/2024
|
$256.64
|
PP = $255.28
|
|
MB = $268.04
|
Most Recent Note - 11/22/2024 1:17:21 PM
Y - Color code is changed to yellow while consolidating near its downward sloping 50 DMA line ($241.85) with volume totals cooling. Little resistance remains due to overhead supply.
>>> FEATURED STOCK ARTICLE : Recent Slump Below 50-Day Moving Average Raised Concerns - 11/18/2024 |
View all notes |
Set NEW NOTE alert |
Company Profile |
SEC
News |
Chart |
Request a new note
C
A
S
I |
ATGE
-
NYSE
Adtalem Global Education
Consumer Svcs-Education
|
$90.08
|
+1.26
1.42% |
$91.21
|
337,331
90.68% of 50 DAV
50 DAV is 372,000
|
$92.93
-3.07%
|
10/30/2024
|
$83.34
|
PP = $80.28
|
|
MB = $84.29
|
Most Recent Note - 11/21/2024 1:53:05 PM
G - Posting a gain today with light volume. Prior highs in the $80 area define initial support to watch on pullbacks. Fundamentals remain strong.
>>> FEATURED STOCK ARTICLE : Holding Ground Following Recent Technical Breakout - 11/4/2024 |
View all notes |
Set NEW NOTE alert |
Company Profile |
SEC
News |
Chart |
Request a new note
C
A
S
I |
TW
-
NASDAQ
Tradeweb Markets
Financial Svcs-Specialty
|
$135.99
|
+0.92
0.68% |
$136.23
|
814,912
98.30% of 50 DAV
50 DAV is 829,000
|
$137.44
-1.06%
|
11/19/2024
|
$134.41
|
PP = $136.23
|
|
MB = $143.04
|
Most Recent Note - 11/19/2024 9:00:56 PM
Y - Finished strong today with above average volume behind its 4th consecutive gain. Color code was changed to yellow with pivot point cited based on its 10/15/24 high plus 10 cents. Found support recently at its 50 DMA line ($127.73). Subsequent volume-driven gains above the pivot point may trigger a proper technical buy signal. Reported earnings +36% on +37% sales revenues for the Sep '24 quarter versus the year ago period, its 4th quarterly comparison above the +25% minimum earnings guideline (C criteria). Annual earnings history has been strong since its $27 IPO on 4/04/19 and an additional Public Offerings on 10/17/19 and 4/24/20. See the latest FSU analysis for more details and a new annotated graph.
>>> FEATURED STOCK ARTICLE : Tradeweb Markets Perched Near High - 11/19/2024 |
View all notes |
Set NEW NOTE alert |
Company Profile |
SEC
News |
Chart |
Request a new note
C
A
S
I |
Symbol/Exchange
Company Name
Industry Group |
PRICE |
CHANGE
(%Change) |
Day High |
Volume
(% DAV)
(% 50 day avg vol) |
52 Wk Hi
% From Hi |
Featured
Date |
Price
Featured |
Pivot Featured |
|
Max Buy |
|
|
|
THESE ARE NOT BUY RECOMMENDATIONS!
Comments contained in the body of this report are technical
opinions only. The material herein has been obtained
from sources believed to be reliable and accurate, however,
its accuracy and completeness cannot be guaranteed.
This site is not an investment advisor, hence it does
not endorse or recommend any securities or other investments.
Any recommendation contained in this report may not
be suitable for all investors and it is not to be deemed
an offer or solicitation on our part with respect to
the purchase or sale of any securities. All trademarks,
service marks and trade names appearing in this report
are the property of their respective owners, and are
likewise used for identification purposes only.
This report is a service available
only to active Paid Premium Members.
You may opt-out of receiving report notifications
at any time. Questions or comments may be submitted
by writing to Premium Membership Services 665 S.E. 10 Street, Suite 201 Deerfield Beach, FL 33441-5634 or by calling 1-800-965-8307
or 954-785-1121.
|
|
|