You are not logged in.
This means you
CAN ONLY VIEW reports that were published prior to Thursday, April 17, 2025.
You
MUST UPGRADE YOUR MEMBERSHIP if you want to see any current reports.
AFTER MARKET UPDATE - THURSDAY, JANUARY 16TH, 2025
Previous After Market Report Next After Market Report >>>
|
|
|
|
DOW |
-68.42 |
43,153.13 |
-0.16% |
|
Volume |
913,102,694 |
-11% |
|
Volume |
7,278,181,200 |
-3% |
|
NASDAQ |
-172.94 |
19,338.29 |
-0.89% |
|
Advancers |
1,707 |
63% |
|
Advancers |
2,211 |
51% |
|
S&P 500 |
-12.57 |
5,937.34 |
-0.21% |
|
Decliners |
1,000 |
37% |
|
Decliners |
2,118 |
49% |
|
Russell 2000 |
+3.50 |
2,266.79 |
+0.15% |
|
52 Wk Highs |
76 |
|
|
52 Wk Highs |
81 |
|
|
S&P 600 |
+3.86 |
1,434.41 |
+0.27% |
|
52 Wk Lows |
23 |
|
|
52 Wk Lows |
111 |
|
|
 |
Nasdaq Composite Led Major Indices Lower
Kenneth J. Gruneisen - Passed the CAN SLIM® Master's Exam
On Thursday the Nasdaq Composite underperformed its peers, dropping 0.9%, while the Dow Jones Industrial Average (-0.2%) and S&P 500 (-0.2%) traded around their prior closing levels. The Russell 2000 eked out a 0.2% gain. Volume totals reported were lighter than the prior session totals on the NYSE and on the Nasdaq exchange. Breadth was slightly positive as advancers led decliners by a very narrow margin at the NYSE and on the Nasdaq exchange. There were 41 high-ranked companies from the Leaders List that hit new 52-week highs and were listed on the BreakOuts Page, versus 40 on the prior session. New 52-week highs totals expanded and outnumbered new 52-week lows on the NYSE but new lows still outnumbered new highs on the Nasdaq exchange. The major indices' uptrend has come under pressure (M criteria) and stocks have shown the look of a more worrisome correction. Disciplined investors know to reduce exposure during corrections by selling any weakening stocks on a case-by-case basis.
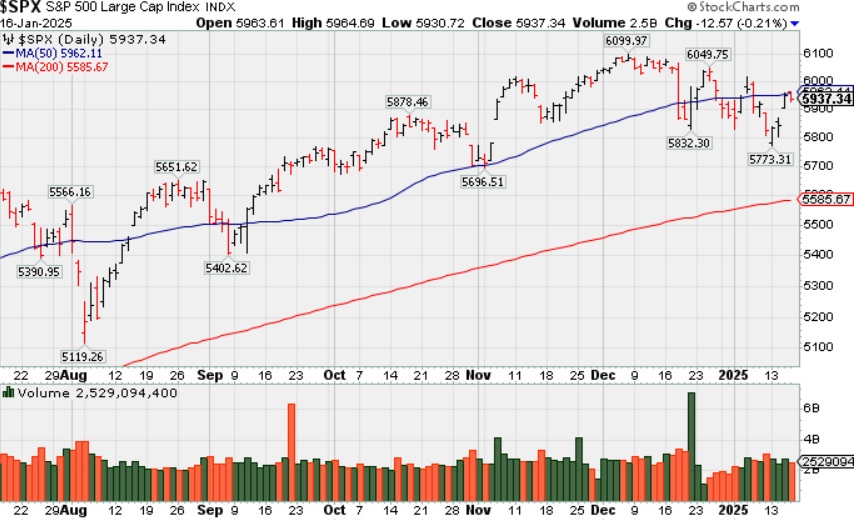
PICTURED: The S&P 500 Index met resistance at its 50-day moving average (DMA) line.
There was a big batch of economic data, earnings news, and headlines to digest today and most of them could've acted as support for the stock market. Retail sales and weekly jobless claims reflected ongoing strength in the economy and labor market, Treasury Secretary nominee Scott Bessent reiterated at his confirmation hearing that the U.S. must get its fiscal house in order while also pursuing pro-growth policies, and Fed Governor Waller (FOMC voter) said he believes that there could possibly be 3-4 rate cuts this year, depending on the data.
Treasury yields declined after Fed Governor Waller's remarks. The 10-yr yield settled five basis points lower at 4.61% and the 2-yr yield settled two basis points lower at 4.24%.
Equities still struggled, though, due to technical resistance after the S&P 500 could not maintain a posture above its 50-day moving average (5,962) and due to losses in influential names including Apple (AAPL -4.0%), NVIDIA (NVDA -2.0%), and Tesla (TSLA -3.4%),.
Some companies that reported earnings traded lower despite better-than-expected results. Bank of America (BAC -1.0%) and US Bancorp (USB -5.6%) were among them while Morgan Stanley (MS +4.0%) hit a fresh 52-week high in response to earnings.
Dow component UnitedHealth (UNH -6.0%) was another name that reported results, stumbling after reporting Q4 and year-end results that featured a higher medical care ratio.
Losses in some of the aforementioned names weighed down the S&P 500 information technology (-1.3%), communication services (-1.0%), and consumer discretionary (-0.9%) sectors while the remaining eight sectors registered gains ranging from 0.4% (health care) to 2.6% (utilities).
|
 Kenneth J. Gruneisen started out as a licensed stockbroker in August 1987, a couple of months prior to the historic stock market crash that took the Dow Jones Industrial Average down -22.6% in a single day. He has published daily fact-based fundamental and technical analysis on high-ranked stocks online for two decades. Through FACTBASEDINVESTING.COM, Kenneth provides educational articles, news, market commentary, and other information regarding proven investment systems that work in good times and bad.
Comments contained in the body of this report are technical opinions only and are not necessarily those of Gruneisen Growth Corp. The material herein has been obtained from sources believed to be reliable and accurate, however, its accuracy and completeness cannot be guaranteed. Our firm, employees, and customers may effect transactions, including transactions contrary to any recommendation herein, or have positions in the securities mentioned herein or options with respect thereto. Any recommendation contained in this report may not be suitable for all investors and it is not to be deemed an offer or solicitation on our part with respect to the purchase or sale of any securities. |
|
 |
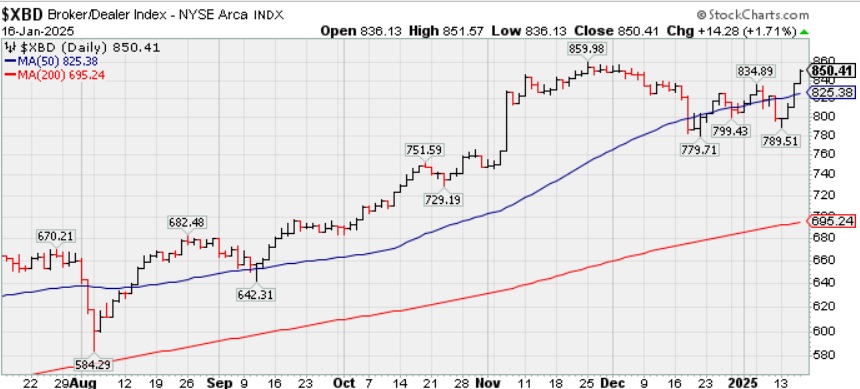
Broker/Dealer Index and Tech Indexes Rose
Kenneth J. Gruneisen - Passed the CAN SLIM® Master's Exam
The Broker/Dealer Index ($XBD +1.71%) posted a standout gain while the Bank Index ($BKX -0.24%) and the Retail Index ($RLX -0.57%) fell on Thursday. The tech sector had a slightly positive bias as the Semiconductor Index ($SOX +0.18%), Networking Index ($NWX +0.26%), and the Biotech Index ($BTK +0.06%) each posted a small gain. The Gold & Silver Index ($XAU -0.56%) and the Oil Services Index ($OSX -0.52%) both posted small losses while the Integrated Oil Index ($XOI +0.20%) posted a small gain.
PICTURED: The Broker/Dealer Index ($XBD +1.71%) posted a 4th consecutive solid gain, rebounding above its 50-day moving average (DMA) line toward its all-time high..
| Oil Services |
$OSX |
76.96 |
-0.41 |
-0.52% |
+6.01% |
| Integrated Oil |
$XOI |
1,919.92 |
+3.79 |
+0.20% |
+8.87% |
| Semiconductor |
$SOX |
5,162.96 |
+9.29 |
+0.18% |
+3.68% |
| Networking |
$NWX |
1,285.14 |
+3.36 |
+0.26% |
+2.93% |
| Broker/Dealer |
$XBD |
850.41 |
+14.28 |
+1.71% |
+5.60% |
| Retail Index |
$RLX |
5,213.35 |
-29.80 |
-0.57% |
+0.75% |
| Gold & Silver |
$XAU |
146.02 |
-0.83 |
-0.56% |
+6.45% |
| Bank |
$BKX |
134.56 |
-0.33 |
-0.24% |
+5.56% |
| Biotech |
$BTK |
6,021.24 |
+3.88 |
+0.06% |
+4.80% |
|
|
|
 |
Featured Stocks
Kenneth J. Gruneisen - Passed the CAN SLIM® Master's Exam
Symbol/Exchange
Company Name
Industry Group | PRICE | CHANGE
(%Change) | Day High | Volume
(% DAV)
(% 50 day avg vol) | 52 Wk Hi
% From Hi | Featured
Date | Price
Featured | Pivot Featured | | Max Buy |  GVA - NYSE GVA - NYSE
Granite Construction
Bldg-Heavy Construction | $92.21 | +0.60
0.65% | $92.77 | 389,157
65.74% of 50 DAV
50 DAV is 592,000 | $105.20
-12.35%
| 6/11/2024 | $59.76 | PP = $64.33 | | MB = $67.55 | Most Recent Note - 1/15/2025 8:49:28 PM
G - Posted a 3rd consecutive gain today rising near its 50 DMA line ($93.80). A rebound above that short-term average is needed for its outlook to improve. Sputtering after a noted "negative reversal" at its all-time high. Reported Sep ''24 quarterly earnings +19% on +14% sales revenues versus the year-ago period, repeatedly noted as "below the +25% minimum guideline (C criteria) of the fact-based investment system."
>>> FEATURED STOCK ARTICLE : Negative Reversal After Hitting New All-Time High - 12/6/2024 | View all notes | Set NEW NOTE alert | Company Profile | SEC News | Chart | Request a new note C A S I | TXRH - NASDAQ
Texas Roadhouse
Retail-Restaurants | $178.32 | -0.97
-0.54% | $180.76 | 648,049
92.98% of 50 DAV
50 DAV is 697,000 | $206.04
-13.45%
| 7/26/2024 | $173.08 | PP = $175.82 | | MB = $184.61 | Most Recent Note - 1/14/2025 12:40:56 PM
G - Managed a "positive reversal" on the prior session after testing support at its 200 DMA line ($173.58). Lingering below its 50 DMA line ($190.30) in recent weeks and a rebound above the 50 DMA line is still needed for its outlook to improve.
>>> FEATURED STOCK ARTICLE : Hovering Near High After Recent Volume-driven Gains - 11/15/2024 | View all notes | Set NEW NOTE alert | Company Profile | SEC News | Chart | Request a new note C A S I | HWM - NYSE
Howmet Aerospace
Aerospace/Defense | $122.98 | +1.12
0.92% | $123.55 | 2,895,874
120.41% of 50 DAV
50 DAV is 2,405,000 | $124.15
-0.94%
| 1/8/2025 | $115.05 | PP = $120.81 | | MB = $126.85 | Most Recent Note - 1/15/2025 12:28:57 PM
Y - Gapped up today for a 2nd consecutive session, hitting a new all-time high. Noted twice since new pivot point noted on 1/08/25 - "Subsequent volume-driven gains above the pivot point may trigger a new (or add-on) technical buy signal. Found support recently above the prior high ($106.93 on 10/21/24). Fundamentals remain strong."
>>> FEATURED STOCK ARTICLE : Extended From Prior Base and Perched at High - 12/5/2024 | View all notes | Set NEW NOTE alert | Company Profile | SEC News | Chart | Request a new note C A S I | NGVC - NYSE
Natural Grocers
Retail-Super/Mini Mkts | $39.96 | -0.42
-1.04% | $40.53 | 94,112
79.76% of 50 DAV
50 DAV is 118,000 | $47.57
-16.00%
| 11/5/2024 | $30.57 | PP = $30.42 | | MB = $31.94 | Most Recent Note - 1/15/2025 8:43:06 PM
G - Posted a 3rd consecutive gain today after halting its slide at its 50 DMA line ($39.16). More damaging losses would raise serious concerns and trigger a worrisome technical sell signal. Reported Sep ''24 quarterly earnings +50% on +9% sales revenues versus the year-ago period.
>>> FEATURED STOCK ARTICLE : Consolidating After Considerable Rally to New Highs - 12/16/2024 | View all notes | Set NEW NOTE alert | Company Profile | SEC News | Chart | Request a new note C A S I | CLS - NYSE
Celestica
Elec-Contract Mfg | $110.72 | +3.22
3.00% | $115.52 | 3,476,874
158.18% of 50 DAV
50 DAV is 2,198,000 | $108.25
2.28%
| 10/11/2024 | $57.62 | PP = $63.59 | | MB = $66.77 |  Most Recent Note - 1/16/2025 12:26:44 PM Most Recent Note - 1/16/2025 12:26:44 PM
G - Extended from any sound base and hitting a new all-time high with today's big gap up gain adding to a recent spurt higher. Its 50 DMA line ($91.43) defines initial support to watch on pullbacks.
>>> FEATURED STOCK ARTICLE : Pulling Back After Considerable Rally - 11/13/2024 | View all notes | Set NEW NOTE alert | Company Profile | SEC News | Chart | Request a new note C A S I | Symbol/Exchange
Company Name
Industry Group | PRICE | CHANGE
(%Change) | Day High | Volume
(% DAV)
(% 50 day avg vol) | 52 Wk Hi
% From Hi | Featured
Date | Price
Featured | Pivot Featured | | Max Buy | PAY - NYSE
Paymentus Holdings
Finance-CrdtCard/PmtPr | $30.24 | -0.10
-0.33% | $30.87 | 565,971
109.05% of 50 DAV
50 DAV is 519,000 | $38.94
-22.34%
| 1/3/2025 | $34.21 | PP = $38.94 | | MB = $40.89 | Most Recent Note - 1/15/2025 8:44:33 PM
G - Still lingering below its 50 DMA line ($33) after noted losses backed by above average volume. A prompt rebound above the 50 DMA line is needed for its outlook to improve.
>>> FEATURED STOCK ARTICLE : Losses Below 50-Day Moving Average Hurt Outlook - 1/8/2025 | View all notes | Set NEW NOTE alert | Company Profile | SEC News | Chart | Request a new note C A S I | RMD - NYSE
ResMed
Medical-Products | $237.13 | +3.75
1.61% | $240.60 | 797,110
100.14% of 50 DAV
50 DAV is 796,000 | $260.49
-8.97%
| 10/25/2024 | $256.64 | PP = $255.28 | | MB = $268.04 | Most Recent Note - 1/15/2025 8:46:46 PM
G - Posted a gain today with above average volume. A rebound above its 50 DMA line ($239.66) is still needed for its outlook to improve. Its Relative Strength Rating is 80, at the 80+ minimum guideline for buy candidates. Recent lows and its 200 DMA line define important near-term support in the $223-224 area.
>>> FEATURED STOCK ARTICLE : Recent Slump Below 50-Day Moving Average Raised Concerns - 11/18/2024 | View all notes | Set NEW NOTE alert | Company Profile | SEC News | Chart | Request a new note C A S I | ATGE - NYSE
Adtalem Global Education
Consumer Svcs-Education | $97.34 | -0.11
-0.11% | $98.64 | 311,813
78.15% of 50 DAV
50 DAV is 399,000 | $98.50
-1.18%
| 12/31/2024 | $91.50 | PP = $93.03 | | MB = $97.68 | Most Recent Note - 1/13/2025 4:32:39 PM
Y - Posted a gain with light volume after a "positive reversal" today and it is perched within striking distance of its all-time high. New pivot point was cited based on its 11/06/24 high plus 10 cents. Still consolidating in an orderly fashion above its 50 DMA line ($89.35) which defines initial support above the prior low ($84.79 on 12/18/24). Subsequent volume-driven gains above its pivot point may trigger a new (or add-on) technical buy signal. Fundamentals remain strong.
>>> FEATURED STOCK ARTICLE : Hovering Near High With Volume Totals Cooling - 12/4/2024 | View all notes | Set NEW NOTE alert | Company Profile | SEC News | Chart | Request a new note C A S I | TW - NASDAQ
Tradeweb Markets
Financial Svcs-Specialty | $131.16 | +2.09
1.62% | $131.74 | 698,541
82.57% of 50 DAV
50 DAV is 846,000 | $141.69
-7.43%
| 11/19/2024 | $134.41 | PP = $136.23 | | MB = $143.04 | Most Recent Note - 1/15/2025 12:45:56 PM
G - Slumping further below its 50 DMA line ($132) with today's big loss approaching prior lows in the $125 area which define the next very important support level to watch. More damaging losses would raise serious concerns. A rebound above the 50 DMA line is needed for its outlook to improve and it must produce a volume-driven gain above the pivot point to trigger a proper technical buy signal. It was highlighted in yellow with pivot point cited based on its 10/15/24 high plus 10 cents.
>>> FEATURED STOCK ARTICLE : Tradeweb Markets Perched Near High - 11/19/2024 | View all notes | Set NEW NOTE alert | Company Profile | SEC News | Chart | Request a new note C A S I | ATAT - NASDAQ
Atour Lifestyle Hldgs ADR
Leisure-Lodging | $25.33 | -0.02
-0.08% | $25.54 | 578,041
45.91% of 50 DAV
50 DAV is 1,259,000 | $29.90
-15.28%
| 12/9/2024 | $29.34 | PP = $29.25 | | MB = $30.71 | Most Recent Note - 1/13/2025 4:28:11 PM
G - Slumped further below its 50 DMA line ($26.57) today with a loss backed by lighter volume. Noted losses raised serious concerns and triggered a technical sell signal. A rebound above the 50 DMA line is needed for its outlook to improve.
>>> FEATURED STOCK ARTICLE : Volume Above Average Behind Breakout Gain - 12/9/2024 | View all notes | Set NEW NOTE alert | Company Profile | SEC News | Chart | Request a new note C A S I | Symbol/Exchange
Company Name
Industry Group | PRICE | CHANGE
(%Change) | Day High | Volume
(% DAV)
(% 50 day avg vol) | 52 Wk Hi
% From Hi | Featured
Date | Price
Featured | Pivot Featured | | Max Buy | CRAI - NASDAQ
CRA International
Comml Svcs-Consulting | $182.92 | -0.28
-0.15% | $185.51 | 37,792
107.98% of 50 DAV
50 DAV is 35,000 | $210.70
-13.18%
| 12/17/2024 | $208.34 | PP = $208.48 | | MB = $218.90 | Most Recent Note - 1/15/2025 8:48:02 PM
G - Still lingering below its 50 DMA line. A rebound above the 50 DMA line ($190) is needed for its outlook to improve. Its 200 DMA line ($173) defines important near-term support. Fundamentals remain strong.
>>> FEATURED STOCK ARTICLE : Volume-Driven Gain for New High Triggered Technical Buy Signal - 12/17/2024 | View all notes | Set NEW NOTE alert | Company Profile | SEC News | Chart | Request a new note C A S I | LRN - NYSE
Stride
Consumer Svcs-Education | $112.95 | +1.59
1.43% | $115.42 | 798,669
110.93% of 50 DAV
50 DAV is 720,000 | $114.72
-1.54%
| 1/10/2025 | $114.31 | PP = $112.90 | | MB = $118.55 | Most Recent Note - 1/16/2025 12:47:58 PM
Y - Rising above the pivot point cited based on its 12/04/24 high and hitting a new all-time high with today's early gain. Recently consolidated in an orderly fashion above its 50 DMA line ($105). the 1/10/25 mid-day report noted - "A gain and strong close above the pivot point backed by at least +40% above average volume may clinch a technical buy signal. Reported Sep '24 quarterly earnings +755% on +15% sales revenues versus the year ago period. Three of the 4 latest quarterly comparisons were well above the +25% minimum earnings guideline (C criteria). Annual earnings (A criteria) history has been strong after a downturn in FY '20."
>>> FEATURED STOCK ARTICLE : Encountered Distributional Pressure Amid Broader Weakness - 1/10/2025 | View all notes | Set NEW NOTE alert | Company Profile | SEC News | Chart | Request a new note C A S I |
|
|
|
Color Codes Explained :
Y - Better candidates highlighted by our
staff of experts.
G - Previously featured
in past reports as yellow but may no longer be buyable under the
guidelines.
***Last / Change / Volume data in this table is the closing quote data***
|
|
|
THESE ARE NOT BUY RECOMMENDATIONS!
Comments contained in the body of this report are technical
opinions only. The material herein has been obtained
from sources believed to be reliable and accurate, however,
its accuracy and completeness cannot be guaranteed.
This site is not an investment advisor, hence it does
not endorse or recommend any securities or other investments.
Any recommendation contained in this report may not
be suitable for all investors and it is not to be deemed
an offer or solicitation on our part with respect to
the purchase or sale of any securities. All trademarks,
service marks and trade names appearing in this report
are the property of their respective owners, and are
likewise used for identification purposes only.
This report is a service available
only to active Paid Premium Members.
You may opt-out of receiving report notifications
at any time. Questions or comments may be submitted
by writing to Premium Membership Services 665 S.E. 10 Street, Suite 201 Deerfield Beach, FL 33441-5634 or by calling 1-800-965-8307
or 954-785-1121.
|
|
|