You are not logged in.
This means you
CAN ONLY VIEW reports that were published prior to Wednesday, April 16, 2025.
You
MUST UPGRADE YOUR MEMBERSHIP if you want to see any current reports.
AFTER MARKET UPDATE - MONDAY, JANUARY 13TH, 2025
Previous After Market Report Next After Market Report >>>
|
|
|
|
DOW |
+348.16 |
42,286.61 |
+0.83% |
|
Volume |
1,022,860,835 |
-4% |
|
Volume |
7,830,818,100 |
-9% |
|
NASDAQ |
-107.89 |
19,053.74 |
-0.56% |
|
Advancers |
1,477 |
55% |
|
Advancers |
1,837 |
42% |
|
S&P 500 |
-0.06 |
5,826.98 |
-0.00% |
|
Decliners |
1,223 |
45% |
|
Decliners |
2,548 |
58% |
|
Russell 2000 |
-0.48 |
2,188.75 |
-0.02% |
|
52 Wk Highs |
15 |
|
|
52 Wk Highs |
41 |
|
|
S&P 600 |
+5.12 |
1,387.06 |
+0.37% |
|
52 Wk Lows |
240 |
|
|
52 Wk Lows |
341 |
|
|
 |
Major Indices Werte Mixed With Leadership Remaining Thin
Kenneth J. Gruneisen - Passed the CAN SLIM® Master's Exam
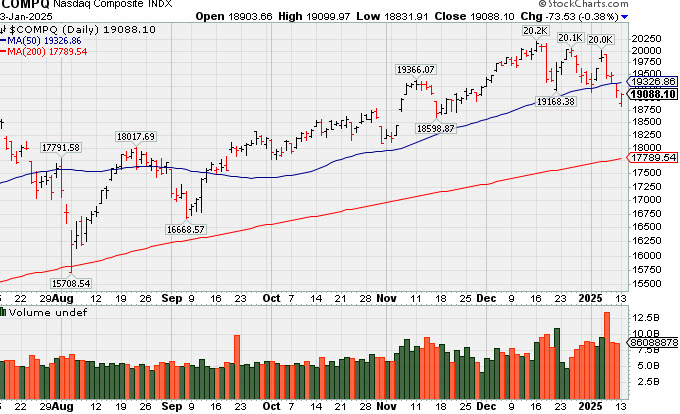
The Nasdaq Composite (-0.4%) closed lower while the S&P 500 (+0.2%), Russell 2000 (+0.2%), and Dow Jones Industrial Average (+0.9%) closed higher. The volume totals reported were lighter than the prior session totals on the NYSE and on the Nasdaq exchange. Decliners led advancers by a 4-3 margin at the Nasdaq exchange while advancers led decliners by a 7-6 margin on the NYSE. Leadership thinned as there were only 2 high-ranked companies from the Leaders List that hit new 52-week highs and were listed on the BreakOuts Page, versus 6 on the prior session. New 52-week lows totals again expanded and outnumbered shrinking new highs totals on the NYSE and on the Nasdaq exchange. The major indices' uptrend has come under pressure (M criteria) and stocks have shown the look of a more worrisome corrrection. Disciplined investors know to reduce exposure during corrections by selling any weakening stocks on a case-by-case basis.
PICTURED: The Nasdaq Composite Index suffered a 4th consecutive loss as it has slumped below its 50-day moving average (DMA) line.
There was no US economic data of note today but the 10-yr yield rose another three basis points to 4.80% and the 2-yr yield settled unchanged at 4.40%. The 30-yr bond yield settled just below 5.00%, up two basis points to 4.99%. Rising oil prices ($78.99/bbl, +2.67, +3.6%) and the New York Fed's Survey of Consumer Expectations stoked the market's fears about higher inflation for longer.
UnitedHealth (UNH +3.9%) rose in response to news that the U.S. proposed a +4.3% increase to Medicare Advantage plan payments, a $21 billion boost to insurers for Medicare payments. Meanwhile, Moderna (MRNA -16.8%) is a standout loser after slashing its FY25 revenue outlook. Bank stocks outperformed in front earnings reports this week from big names in the sector.
|
 Kenneth J. Gruneisen started out as a licensed stockbroker in August 1987, a couple of months prior to the historic stock market crash that took the Dow Jones Industrial Average down -22.6% in a single day. He has published daily fact-based fundamental and technical analysis on high-ranked stocks online for two decades. Through FACTBASEDINVESTING.COM, Kenneth provides educational articles, news, market commentary, and other information regarding proven investment systems that work in good times and bad.
Comments contained in the body of this report are technical opinions only and are not necessarily those of Gruneisen Growth Corp. The material herein has been obtained from sources believed to be reliable and accurate, however, its accuracy and completeness cannot be guaranteed. Our firm, employees, and customers may effect transactions, including transactions contrary to any recommendation herein, or have positions in the securities mentioned herein or options with respect thereto. Any recommendation contained in this report may not be suitable for all investors and it is not to be deemed an offer or solicitation on our part with respect to the purchase or sale of any securities. |
|
 |
Biotech and Energy-Linked Groups Rose
Kenneth J. Gruneisen - Passed the CAN SLIM® Master's Exam
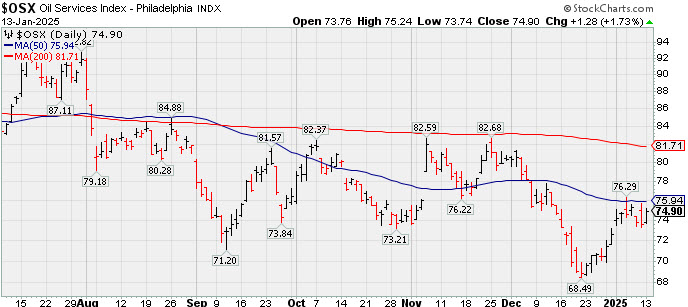
The Bank Index ($BKX -1.24%) suffered a big loss while the Broker/Dealer Index ($XBD -0.00%) finished flat and the Retail Index ($RLX -0.16%) ended slighgtly lower on Monday. The tech sector was mixed as the Semiconductor Index ($SOX -0.35%) and the Networking Index ($NWX -0.82%) both edged to the downside while the Biotech Index ($BTK +2.21%) posted a solid gain. Commodity-linked groups were mixed as the Gold & Silver Index ($XAU -2.02%) fell while the Integrated Oil Index ($XOI +1.91%) and the Oil Services Index ($OSX +1.73%) both posted solid gains.
PICTURED: The Oil Services Index ($OSX +1.73%) posted a gain but it has been meeting resistance at its 50-day moving average (DMA) line.
| Oil Services |
$OSX |
74.56 |
+0.94 |
+1.27% |
+2.70% |
| Integrated Oil |
$XOI |
1,871.42 |
+28.42 |
+1.54% |
+6.12% |
| Semiconductor |
$SOX |
5,012.23 |
-25.24 |
-0.50% |
+0.65% |
| Networking |
$NWX |
1,231.98 |
-12.85 |
-1.03% |
-1.33% |
| Broker/Dealer |
$XBD |
797.00 |
-1.82 |
-0.23% |
-1.04% |
| Retail Index |
$RLX |
5,133.63 |
-8.00 |
-0.16% |
-0.79% |
| Gold & Silver |
$XAU |
142.36 |
-2.96 |
-2.04% |
+3.77% |
| Bank |
$BKX |
127.39 |
+1.45 |
+1.15% |
-0.06% |
| Biotech |
$BTK |
6,027.96 |
+111.62 |
+1.89% |
+4.91% |
|
|
|
 |
Featured Stocks
Kenneth J. Gruneisen - Passed the CAN SLIM® Master's Exam
Symbol/Exchange
Company Name
Industry Group | PRICE | CHANGE
(%Change) | Day High | Volume
(% DAV)
(% 50 day avg vol) | 52 Wk Hi
% From Hi | Featured
Date | Price
Featured | Pivot Featured | | Max Buy |  GVA - NYSE GVA - NYSE
Granite Construction
Bldg-Heavy Construction | $87.99 | +0.75
0.86% | $88.10 | 269,986
43.27% of 50 DAV
50 DAV is 624,000 | $105.20
-16.36%
| 6/11/2024 | $59.76 | PP = $64.33 | | MB = $67.55 | Most Recent Note - 1/8/2025 5:04:36 PM
G - Still sputtering below its 50 DMA line ($93.27), and a rebound above that short-term average is needed for its outlook to improve. Sputtering after a noted "negative reversal" at its all-time high. Reported Sep ''24 quarterly earnings +19% on +14% sales revenues versus the year-ago period, repeatedly noted as "below the +25% minimum guideline (C criteria) of the fact-based investment system."
>>> FEATURED STOCK ARTICLE : Negative Reversal After Hitting New All-Time High - 12/6/2024 | View all notes | Set NEW NOTE alert | Company Profile | SEC News | Chart | Request a new note C A S I | TXRH - NASDAQ
Texas Roadhouse
Retail-Restaurants | $180.16 | +2.04
1.15% | $180.54 | 657,319
94.58% of 50 DAV
50 DAV is 695,000 | $206.04
-12.56%
| 7/26/2024 | $173.08 | PP = $175.82 | | MB = $184.61 | Most Recent Note - 1/8/2025 5:14:53 PM
G - Managed a "positive reversal" today after slumping near its 200 DMA line ($173). Lingering below its 50 DMA line ($191) in recent weeks and a rebound above the 50 DMA line is still needed for its outlook to improve.
>>> FEATURED STOCK ARTICLE : Hovering Near High After Recent Volume-driven Gains - 11/15/2024 | View all notes | Set NEW NOTE alert | Company Profile | SEC News | Chart | Request a new note C A S I | HWM - NYSE
Howmet Aerospace
Aerospace/Defense | $114.65 | +2.01
1.78% | $114.87 | 1,659,755
69.71% of 50 DAV
50 DAV is 2,381,000 | $120.71
-5.02%
| 1/8/2025 | $115.05 | PP = $120.81 | | MB = $126.85 | Most Recent Note - 1/8/2025 5:09:17 PM
Y - Posted a big gain today with average volume rising further above its 50 DMA line ($112.27). Color code is changed to yellow with new pivot point cited based on its 12/06/24 high plus 10 cents after a short flat base. Subsequent volume-driven gains above the pivot point may trigger a new (or add-on) technical buy signal. Found support recently above the prior high ($106.93 on 10/21/24). Fundamentals remain strong.
>>> FEATURED STOCK ARTICLE : Extended From Prior Base and Perched at High - 12/5/2024 | View all notes | Set NEW NOTE alert | Company Profile | SEC News | Chart | Request a new note C A S I | NGVC - NYSE
Natural Grocers
Retail-Super/Mini Mkts | $38.64 | +0.26
0.68% | $39.10 | 38,286
33.29% of 50 DAV
50 DAV is 115,000 | $47.57
-18.77%
| 11/5/2024 | $30.57 | PP = $30.42 | | MB = $31.94 |  Most Recent Note - 1/13/2025 4:29:22 PM Most Recent Note - 1/13/2025 4:29:22 PM
G - Halted its slide today at its 50 DMA line ($38.66). More damaging losses would raise serious concerns and trigger a worrisome technical sell signal. Reported Sep ''24 quarterly earnings +50% on +9% sales revenues versus the year-ago period.
>>> FEATURED STOCK ARTICLE : Consolidating After Considerable Rally to New Highs - 12/16/2024 | View all notes | Set NEW NOTE alert | Company Profile | SEC News | Chart | Request a new note C A S I | CLS - NYSE
Celestica
Elec-Contract Mfg | $100.05 | -3.60
-3.47% | $102.10 | 2,436,269
113.21% of 50 DAV
50 DAV is 2,152,000 | $104.92
-4.65%
| 10/11/2024 | $57.62 | PP = $63.59 | | MB = $66.77 | Most Recent Note - 1/13/2025 12:46:20 PM
G - Pulling back today following 2 consecutive gains hitting new all-time highs. Its 50 DMA line ($89.11) defines initial support to watch on pullbacks.
>>> FEATURED STOCK ARTICLE : Pulling Back After Considerable Rally - 11/13/2024 | View all notes | Set NEW NOTE alert | Company Profile | SEC News | Chart | Request a new note C A S I | Symbol/Exchange
Company Name
Industry Group | PRICE | CHANGE
(%Change) | Day High | Volume
(% DAV)
(% 50 day avg vol) | 52 Wk Hi
% From Hi | Featured
Date | Price
Featured | Pivot Featured | | Max Buy | PAY - NYSE
Paymentus Holdings
Finance-CrdtCard/PmtPr | $30.10 | -0.16
-0.51% | $30.19 | 272,919
54.58% of 50 DAV
50 DAV is 500,000 | $38.94
-22.71%
| 1/3/2025 | $34.21 | PP = $38.94 | | MB = $40.89 | Most Recent Note - 1/8/2025 5:46:28 PM
G - Color code was changed to green after slumping below its 50 DMA line ($32.57) with losses backed by above average volume. A prompt rebound above the 50 DMA line is needed for its outlook to improve. See the latest FSU analysis for more details and a new annotated graph.
>>> FEATURED STOCK ARTICLE : Losses Below 50-Day Moving Average Hurt Outlook - 1/8/2025 | View all notes | Set NEW NOTE alert | Company Profile | SEC News | Chart | Request a new note C A S I | RMD - NYSE
ResMed
Medical-Products | $230.14 | -3.68
-1.57% | $231.55 | 388,537
47.21% of 50 DAV
50 DAV is 823,000 | $260.49
-11.65%
| 10/25/2024 | $256.64 | PP = $255.28 | | MB = $268.04 | Most Recent Note - 1/8/2025 5:12:37 PM
G - Met resistance at its 50 DMA line today after rebounding with 3 gains marked by light volume. A rebound above its 50 DMA line ($240.67) is needed for its outlook to improve. Its Relative Strength Rating is 82, above the 80+ minimum guideline for buy candidates.
>>> FEATURED STOCK ARTICLE : Recent Slump Below 50-Day Moving Average Raised Concerns - 11/18/2024 | View all notes | Set NEW NOTE alert | Company Profile | SEC News | Chart | Request a new note C A S I | ATGE - NYSE
Adtalem Global Education
Consumer Svcs-Education | $94.21 | +2.55
2.78% | $94.21 | 174,192
41.47% of 50 DAV
50 DAV is 420,000 | $97.37
-3.25%
| 12/31/2024 | $91.50 | PP = $93.03 | | MB = $97.68 | Most Recent Note - 1/13/2025 4:32:39 PM
Y - Posted a gain with light volume after a "positive reversal" today and it is perched within striking distance of its all-time high. New pivot point was cited based on its 11/06/24 high plus 10 cents. Still consolidating in an orderly fashion above its 50 DMA line ($89.35) which defines initial support above the prior low ($84.79 on 12/18/24). Subsequent volume-driven gains above its pivot point may trigger a new (or add-on) technical buy signal. Fundamentals remain strong.
>>> FEATURED STOCK ARTICLE : Hovering Near High With Volume Totals Cooling - 12/4/2024 | View all notes | Set NEW NOTE alert | Company Profile | SEC News | Chart | Request a new note C A S I | TW - NASDAQ
Tradeweb Markets
Financial Svcs-Specialty | $130.19 | -0.90
-0.68% | $131.93 | 416,937
48.99% of 50 DAV
50 DAV is 851,000 | $141.69
-8.12%
| 11/19/2024 | $134.41 | PP = $136.23 | | MB = $143.04 | Most Recent Note - 1/13/2025 4:25:36 PM
G - Color code is changed to green after sinking back below its 50 DMA line ($131.88) with lighter volume behind today''s 2nd consecutive loss. A rebound above the 50 DMA line is needed for its outlook to improve and it must produce a volume-driven gain above the pivot point to trigger a proper technical buy signal. It was highlighted in yellow with pivot point cited based on its 10/15/24 high plus 10 cents.
>>> FEATURED STOCK ARTICLE : Tradeweb Markets Perched Near High - 11/19/2024 | View all notes | Set NEW NOTE alert | Company Profile | SEC News | Chart | Request a new note C A S I | ATAT - NASDAQ
Atour Lifestyle Hldgs ADR
Leisure-Lodging | $24.95 | -0.31
-1.23% | $25.36 | 314,734
24.78% of 50 DAV
50 DAV is 1,270,000 | $29.90
-16.56%
| 12/9/2024 | $29.34 | PP = $29.25 | | MB = $30.71 | Most Recent Note - 1/13/2025 4:28:11 PM
G - Slumped further below its 50 DMA line ($26.57) today with a loss backed by lighter volume. Noted losses raised serious concerns and triggered a technical sell signal. A rebound above the 50 DMA line is needed for its outlook to improve.
>>> FEATURED STOCK ARTICLE : Volume Above Average Behind Breakout Gain - 12/9/2024 | View all notes | Set NEW NOTE alert | Company Profile | SEC News | Chart | Request a new note C A S I | Symbol/Exchange
Company Name
Industry Group | PRICE | CHANGE
(%Change) | Day High | Volume
(% DAV)
(% 50 day avg vol) | 52 Wk Hi
% From Hi | Featured
Date | Price
Featured | Pivot Featured | | Max Buy | CRAI - NASDAQ
CRA International
Comml Svcs-Consulting | $179.41 | +0.56
0.31% | $180.00 | 25,125
71.79% of 50 DAV
50 DAV is 35,000 | $210.70
-14.85%
| 12/17/2024 | $208.34 | PP = $208.48 | | MB = $218.90 | Most Recent Note - 1/8/2025 5:03:17 PM
G - Still lingering below its 50 DMA line. A rebound above the 50 DMA line ($191.05) is needed for its outlook to improve. Fundamentals remain strong.
>>> FEATURED STOCK ARTICLE : Volume-Driven Gain for New High Triggered Technical Buy Signal - 12/17/2024 | View all notes | Set NEW NOTE alert | Company Profile | SEC News | Chart | Request a new note C A S I | LRN - NYSE
Stride
Consumer Svcs-Education | $109.87 | -1.26
-1.13% | $110.22 | 707,991
97.52% of 50 DAV
50 DAV is 726,000 | $114.72
-4.23%
| 1/10/2025 | $114.31 | PP = $112.90 | | MB = $118.55 | Most Recent Note - 1/10/2025 12:58:00 PM
Y - Color code is changed to yellow with pivot point cited based on its 12/04/24 high. Hitting a new all-time high with today's big gain after recently consolidating in an orderly fashion above its 50 DMA line. A gain and strong close above the pivot point backed by at least +40% above average volume may clinch a technical buy signal. Reported Sep '24 quarterly earnings +755% on +15% sales revenues versus the year ago period. Three of the 4 latest quarterly comparisons were well above the +25% minimum earnings guideline (C criteria). Annual earnings (A criteria) history has been strong after a downturn in FY '20.
>>> FEATURED STOCK ARTICLE : Encountered Distributional Pressure Amid Broader Weakness - 1/10/2025 | View all notes | Set NEW NOTE alert | Company Profile | SEC News | Chart | Request a new note C A S I |
|
|
|
Color Codes Explained :
Y - Better candidates highlighted by our
staff of experts.
G - Previously featured
in past reports as yellow but may no longer be buyable under the
guidelines.
***Last / Change / Volume data in this table is the closing quote data***
Symbol/Exchange
Company Name
Industry Group |
PRICE |
CHANGE
(%Change) |
Day High |
Volume
(% DAV)
(% 50 day avg vol) |
52 Wk Hi
% From Hi |
Featured
Date |
Price
Featured |
Pivot Featured |
|
Max Buy |
 GVA
-
NYSE
GVA
-
NYSE
Granite Construction
Bldg-Heavy Construction
|
$87.24
|
-1.15
-1.30% |
$88.07
|
298,892
47.67% of 50 DAV
50 DAV is 627,000
|
$105.20
-17.07%
|
6/11/2024
|
$59.76
|
PP = $64.33
|
|
MB = $67.55
|
Most Recent Note - 1/8/2025 5:04:36 PM
G - Still sputtering below its 50 DMA line ($93.27), and a rebound above that short-term average is needed for its outlook to improve. Sputtering after a noted "negative reversal" at its all-time high. Reported Sep '24 quarterly earnings +19% on +14% sales revenues versus the year-ago period, repeatedly noted as "below the +25% minimum guideline (C criteria) of the fact-based investment system."
>>> FEATURED STOCK ARTICLE : Negative Reversal After Hitting New All-Time High - 12/6/2024 |
View all notes |
Set NEW NOTE alert |
Company Profile |
SEC
News |
Chart |
Request a new note
C
A
S
I |
TXRH
-
NASDAQ
Texas Roadhouse
Retail-Restaurants
|
$178.12
|
-3.93
-2.16% |
$181.65
|
1,189,279
172.86% of 50 DAV
50 DAV is 688,000
|
$206.04
-13.55%
|
7/26/2024
|
$173.08
|
PP = $175.82
|
|
MB = $184.61
|
Most Recent Note - 1/8/2025 5:14:53 PM
G - Managed a "positive reversal" today after slumping near its 200 DMA line ($173). Lingering below its 50 DMA line ($191) in recent weeks and a rebound above the 50 DMA line is still needed for its outlook to improve.
>>> FEATURED STOCK ARTICLE : Hovering Near High After Recent Volume-driven Gains - 11/15/2024 |
View all notes |
Set NEW NOTE alert |
Company Profile |
SEC
News |
Chart |
Request a new note
C
A
S
I |
HWM
-
NYSE
Howmet Aerospace
Aerospace/Defense
|
$112.64
|
-2.41
-2.09% |
$114.73
|
2,450,938
103.15% of 50 DAV
50 DAV is 2,376,000
|
$120.71
-6.69%
|
1/8/2025
|
$115.05
|
PP = $120.81
|
|
MB = $126.85
|
Most Recent Note - 1/8/2025 5:09:17 PM
Y - Posted a big gain today with average volume rising further above its 50 DMA line ($112.27). Color code is changed to yellow with new pivot point cited based on its 12/06/24 high plus 10 cents after a short flat base. Subsequent volume-driven gains above the pivot point may trigger a new (or add-on) technical buy signal. Found support recently above the prior high ($106.93 on 10/21/24). Fundamentals remain strong.
>>> FEATURED STOCK ARTICLE : Extended From Prior Base and Perched at High - 12/5/2024 |
View all notes |
Set NEW NOTE alert |
Company Profile |
SEC
News |
Chart |
Request a new note
C
A
S
I |
NGVC
-
NYSE
Natural Grocers
Retail-Super/Mini Mkts
|
$38.38
|
-1.57
-3.93% |
$39.38
|
111,024
97.39% of 50 DAV
50 DAV is 114,000
|
$47.57
-19.32%
|
11/5/2024
|
$30.57
|
PP = $30.42
|
|
MB = $31.94
|
Most Recent Note - 1/7/2025 6:12:16 PM
G - Pulled back for a 2nd consecutive loss, consolidating above its 50 DMA line ($38). Reported Sep '24 quarterly earnings +50% on +9% sales revenues versus the year-ago period.
>>> FEATURED STOCK ARTICLE : Consolidating After Considerable Rally to New Highs - 12/16/2024 |
View all notes |
Set NEW NOTE alert |
Company Profile |
SEC
News |
Chart |
Request a new note
C
A
S
I |
CLS
-
NYSE
Celestica
Elec-Contract Mfg
|
$103.64
|
+1.17
1.14% |
$104.92
|
3,065,647
142.65% of 50 DAV
50 DAV is 2,149,000
|
$103.46
0.17%
|
10/11/2024
|
$57.62
|
PP = $63.59
|
|
MB = $66.77
|
Most Recent Note - 1/10/2025 12:43:30 PM
G - Volume is above average with today's 2nd consecutive gain hitting new all-time highs, rising from a short consolidation. Its 50 DMA line ($88.51) defines initial support to watch on pullbacks.
>>> FEATURED STOCK ARTICLE : Pulling Back After Considerable Rally - 11/13/2024 |
View all notes |
Set NEW NOTE alert |
Company Profile |
SEC
News |
Chart |
Request a new note
C
A
S
I |
Symbol/Exchange
Company Name
Industry Group |
PRICE |
CHANGE
(%Change) |
Day High |
Volume
(% DAV)
(% 50 day avg vol) |
52 Wk Hi
% From Hi |
Featured
Date |
Price
Featured |
Pivot Featured |
|
Max Buy |
PAY
-
NYSE
Paymentus Holdings
Finance-CrdtCard/PmtPr
|
$30.25
|
-1.40
-4.42% |
$31.61
|
515,002
104.46% of 50 DAV
50 DAV is 493,000
|
$38.94
-22.32%
|
1/3/2025
|
$34.21
|
PP = $38.94
|
|
MB = $40.89
|
Most Recent Note - 1/8/2025 5:46:28 PM
G - Color code was changed to green after slumping below its 50 DMA line ($32.57) with losses backed by above average volume. A prompt rebound above the 50 DMA line is needed for its outlook to improve. See the latest FSU analysis for more details and a new annotated graph.
>>> FEATURED STOCK ARTICLE : Losses Below 50-Day Moving Average Hurt Outlook - 1/8/2025 |
View all notes |
Set NEW NOTE alert |
Company Profile |
SEC
News |
Chart |
Request a new note
C
A
S
I |
RMD
-
NYSE
ResMed
Medical-Products
|
$233.82
|
-2.35
-1.00% |
$235.45
|
1,041,555
124.29% of 50 DAV
50 DAV is 838,000
|
$260.49
-10.24%
|
10/25/2024
|
$256.64
|
PP = $255.28
|
|
MB = $268.04
|
Most Recent Note - 1/8/2025 5:12:37 PM
G - Met resistance at its 50 DMA line today after rebounding with 3 gains marked by light volume. A rebound above its 50 DMA line ($240.67) is needed for its outlook to improve. Its Relative Strength Rating is 82, above the 80+ minimum guideline for buy candidates.
>>> FEATURED STOCK ARTICLE : Recent Slump Below 50-Day Moving Average Raised Concerns - 11/18/2024 |
View all notes |
Set NEW NOTE alert |
Company Profile |
SEC
News |
Chart |
Request a new note
C
A
S
I |
ATGE
-
NYSE
Adtalem Global Education
Consumer Svcs-Education
|
$91.66
|
-2.75
-2.91% |
$93.43
|
251,515
59.04% of 50 DAV
50 DAV is 426,000
|
$97.37
-5.86%
|
12/31/2024
|
$91.50
|
PP = $93.03
|
|
MB = $97.68
|
Most Recent Note - 1/8/2025 4:59:36 PM
Y - Hovering near its high since a new pivot point was cited based on its 11/06/24 high plus 10 cents. Still consolidating in an orderly fashion above its 50 DMA line ($88.60) which defines initial support above prior highs in the $80 area. Subsequent volume-driven gains above its pivot point may trigger a new (or add-on) technical buy signal. Fundamentals remain strong.
>>> FEATURED STOCK ARTICLE : Hovering Near High With Volume Totals Cooling - 12/4/2024 |
View all notes |
Set NEW NOTE alert |
Company Profile |
SEC
News |
Chart |
Request a new note
C
A
S
I |
TW
-
NASDAQ
Tradeweb Markets
Financial Svcs-Specialty
|
$131.08
|
-2.98
-2.22% |
$135.02
|
905,304
106.01% of 50 DAV
50 DAV is 854,000
|
$141.69
-7.49%
|
11/19/2024
|
$134.41
|
PP = $136.23
|
|
MB = $143.04
|
Most Recent Note - 1/3/2025 2:46:05 PM
Y - Color code is changed to yellow after rebounding above its 50 DMA line ($131.91) with today's gain approaching prior highs. It must produce a volume-driven gain above the pivot point to trigger a proper technical buy signal. It was highlighted in yellow with pivot point cited based on its 10/15/24 high plus 10 cents.
>>> FEATURED STOCK ARTICLE : Tradeweb Markets Perched Near High - 11/19/2024 |
View all notes |
Set NEW NOTE alert |
Company Profile |
SEC
News |
Chart |
Request a new note
C
A
S
I |
ATAT
-
NASDAQ
Atour Lifestyle Hldgs ADR
Leisure-Lodging
|
$25.26
|
-0.57
-2.21% |
$25.71
|
563,319
44.04% of 50 DAV
50 DAV is 1,279,000
|
$29.90
-15.52%
|
12/9/2024
|
$29.34
|
PP = $29.25
|
|
MB = $30.71
|
Most Recent Note - 1/6/2025 6:07:32 PM
G - Color code is changed to green after slumping well below its 50 DMA line ($26.69). Today's more damaging loss below the prior low ($25.68 on 12/30/24) raised serious concerns and triggered a technical sell signal.
>>> FEATURED STOCK ARTICLE : Volume Above Average Behind Breakout Gain - 12/9/2024 |
View all notes |
Set NEW NOTE alert |
Company Profile |
SEC
News |
Chart |
Request a new note
C
A
S
I |
Symbol/Exchange
Company Name
Industry Group |
PRICE |
CHANGE
(%Change) |
Day High |
Volume
(% DAV)
(% 50 day avg vol) |
52 Wk Hi
% From Hi |
Featured
Date |
Price
Featured |
Pivot Featured |
|
Max Buy |
CRAI
-
NASDAQ
CRA International
Comml Svcs-Consulting
|
$178.85
|
-5.20
-2.83% |
$184.64
|
29,391
83.97% of 50 DAV
50 DAV is 35,000
|
$210.70
-15.12%
|
12/17/2024
|
$208.34
|
PP = $208.48
|
|
MB = $218.90
|
Most Recent Note - 1/8/2025 5:03:17 PM
G - Still lingering below its 50 DMA line. A rebound above the 50 DMA line ($191.05) is needed for its outlook to improve. Fundamentals remain strong.
>>> FEATURED STOCK ARTICLE : Volume-Driven Gain for New High Triggered Technical Buy Signal - 12/17/2024 |
View all notes |
Set NEW NOTE alert |
Company Profile |
SEC
News |
Chart |
Request a new note
C
A
S
I |
LRN
-
NYSE
Stride
Consumer Svcs-Education
|
$111.13
|
+2.11
1.94% |
$114.72
|
1,626,693
224.37% of 50 DAV
50 DAV is 725,000
|
$112.80
-1.48%
|
1/10/2025
|
$114.31
|
PP = $112.90
|
|
MB = $118.55
|
Most Recent Note - 1/10/2025 12:58:00 PM
Y - Color code is changed to yellow with pivot point cited based on its 12/04/24 high. Hitting a new all-time high with today's big gain after recently consolidating in an orderly fashion above its 50 DMA line. A gain and strong close above the pivot point backed by at least +40% above average volume may clinch a technical buy signal. Reported Sep '24 quarterly earnings +755% on +15% sales revenues versus the year ago period. Three of the 4 latest quarterly comparisons were well above the +25% minimum earnings guideline (C criteria). Annual earnings (A criteria) history has been strong after a downturn in FY '20.
>>> FEATURED STOCK ARTICLE : Encountered Distributional Pressure Amid Broader Weakness - 1/10/2025 |
View all notes |
Set NEW NOTE alert |
Company Profile |
SEC
News |
Chart |
Request a new note
C
A
S
I |
|
|
|
THESE ARE NOT BUY RECOMMENDATIONS!
Comments contained in the body of this report are technical
opinions only. The material herein has been obtained
from sources believed to be reliable and accurate, however,
its accuracy and completeness cannot be guaranteed.
This site is not an investment advisor, hence it does
not endorse or recommend any securities or other investments.
Any recommendation contained in this report may not
be suitable for all investors and it is not to be deemed
an offer or solicitation on our part with respect to
the purchase or sale of any securities. All trademarks,
service marks and trade names appearing in this report
are the property of their respective owners, and are
likewise used for identification purposes only.
This report is a service available
only to active Paid Premium Members.
You may opt-out of receiving report notifications
at any time. Questions or comments may be submitted
by writing to Premium Membership Services 665 S.E. 10 Street, Suite 201 Deerfield Beach, FL 33441-5634 or by calling 1-800-965-8307
or 954-785-1121.
|
|
|